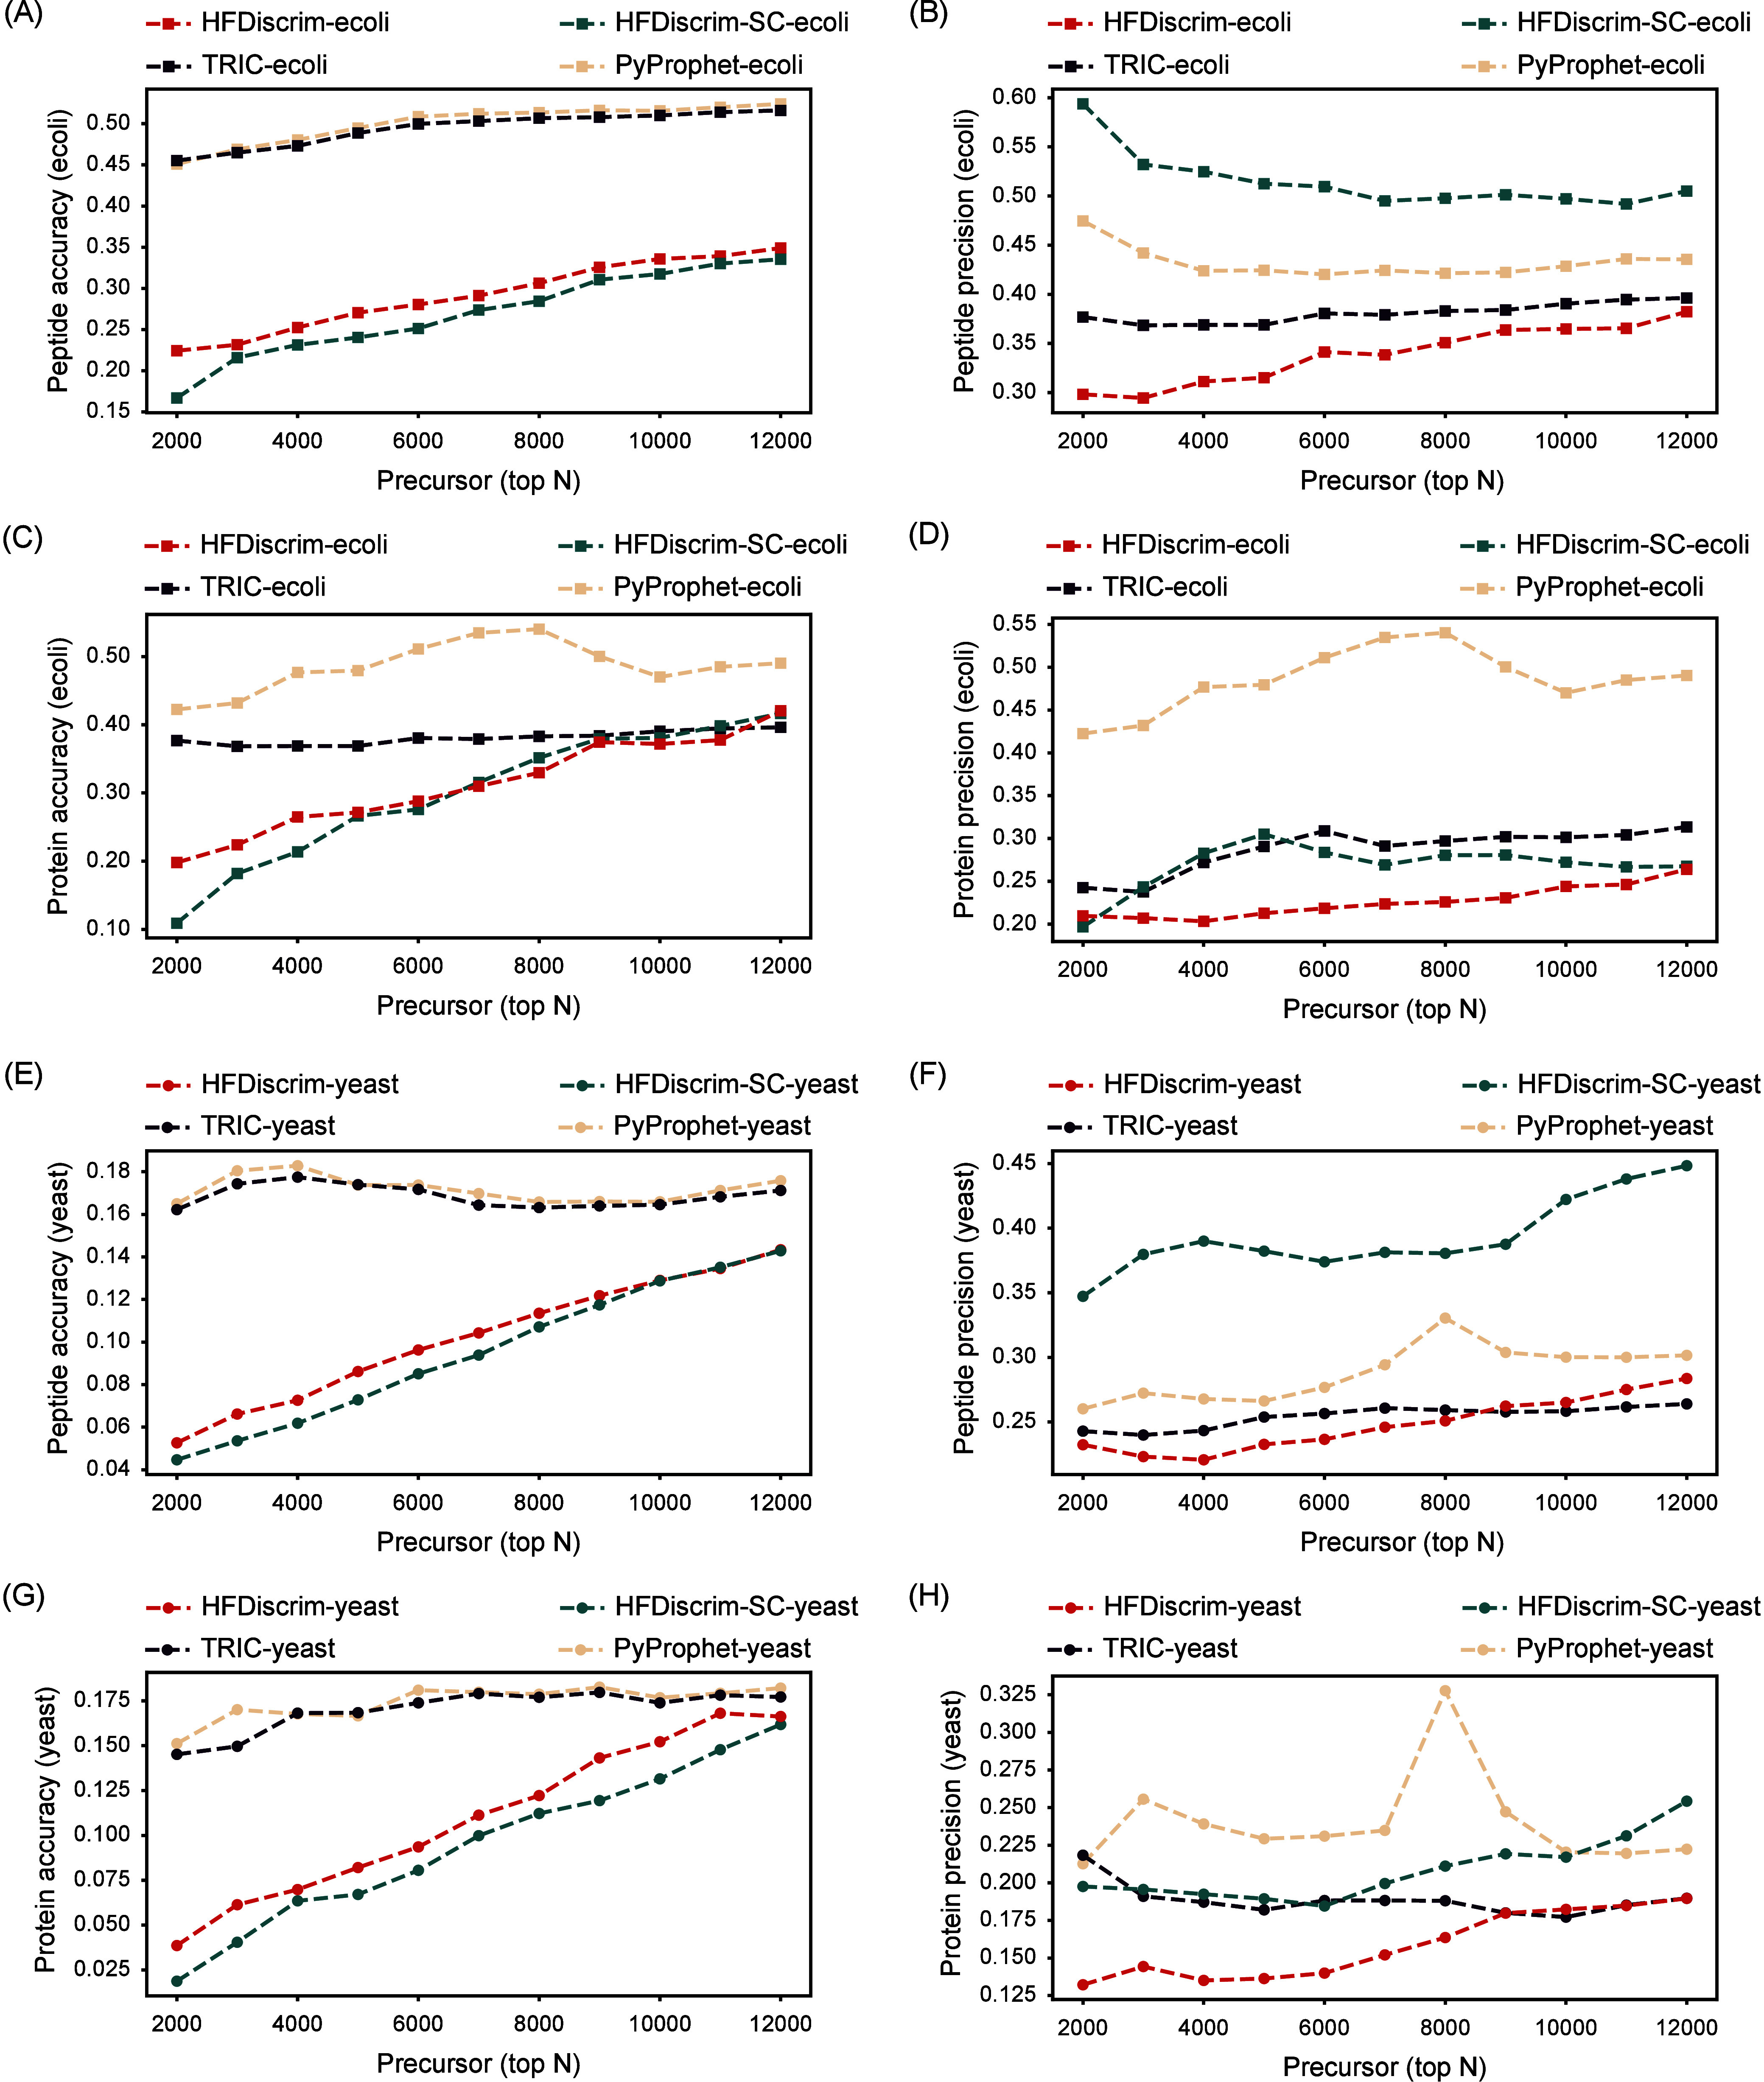
Figure 6.

Quantification of the HYE124 data set, which mixes proteomes from three species in a defined ratio, using HFDiscrim and other tools for DIA. (A) E. coli peptide accuracy, (B) E. coli peptide precision, (C) E. coli protein accuracy, (D) E. coli protein precision, (E) yeast peptide accuracy, (F) yeast peptide precision, (G) yeast protein accuracy, (H) yeast protein precision, as functions of the top N precursors identified. The x-axis represents the top N precursors, while the y-axes show the corresponding accuracy or precision values.
