
Figure 2.
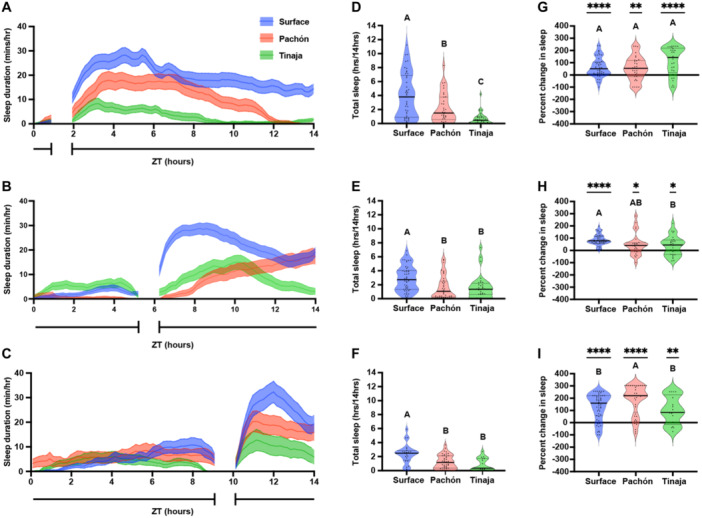
Postfeeding increase in larval Astyanax mexicanus sleep duration is not dependent on daily feeding time. Twenty days post fertilization larvae were fed over a 45‐min window before ZT2 (A, D, G), ZT6 (B, E, H), or ZT10 (C, F, I). (A–C) Sleep profiles of surface, Pachón, and Tinaja larvae, in minutes per hour, averaged across the daylight cycle. Lines and error bars represent the mean ± SEM. (D–F) Cross‐population comparison of total sleep duration in hours over the 14‐hour light cycle. Letters represent significant differences between populations. (D) Total sleep duration around a ZT2 feeding window was significantly different between populations of A. mexicanus (ANOVA: F2, 113 = 20.81, p < 0.0001). (E) Total sleep duration around a ZT6 feeding window was significantly different between surface and cave populations of A. mexicanus (ANOVA: F2, 113 = 8.48, p = 0.0004; Tukey's HSD for Surface‐Pachón, p = 0.001 and Surface‐Tinaja, p = 0.0069). (F) Total sleep duration around a ZT10 feeding window was significantly different between surface and cave populations of A. mexicanus (ANOVA: F2, 81 = 11.64, p < 0.001; Surface‐Pachón, p = 0.0003; Tukey's HSD for surface‐Tinaja, p = 0.0002). (G–I) Percentage change in sleep duration for the 4‐hour period following feeding from total daytime sleep calculated as (proportion of postprandial sleep − proportion of total sleep)/proportion of total sleep. All conditions were significantly different from zero (see Table S1). Letters indicate significant differences between populations. (G) Percent change of postprandial sleep after ZT2 feeding window. There was no significant difference across populations in the percentage of increase in postprandial sleep (ANOVA: F2, 104 = 3.36, p = 0.0417). (H) Percent change of postprandial sleep after ZT6 feeding window. There was no significant different in the percentage of increase in postprandial sleep between surface and Pachón cavefish, but surface fish had a significantly greater increase in sleep than Tinaja cavefish (ANOVA: F2, 96 = 5.758, p = 0.0072; Tukey's HSD for surface‐Tinaja, p = 0.0101). (I) Percent change of postprandial sleep after ZT10 feeding window. Pachón cavefish had a significantly greater percent increase in postprandial sleep than both surface and Tinaja cavefish (ANOVA: F2, 111 = 4.727, p = 0.0107; Tukey's HSD for surface‐Pachón, p = 0.0298; Tukey's HSD for Pachón‐Tinaja, p = 0.0275).