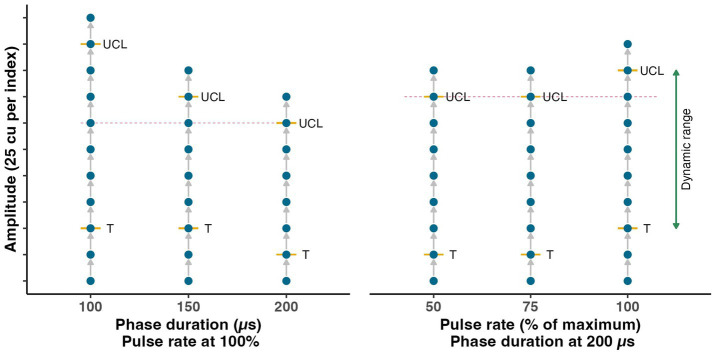
Figure 2.
Schematic representation of the experimental procedure to evaluate the influence of the stimulus amplitude, phase duration and pulse rate. The dynamic range was determined six times for each electrode with different phase duration and pulse rate settings (i.e., each vertical line). Stimulation amplitude was increased stepwise (visualized by blue dots) until threshold of activation (T) was reached. Subsequently, the amplitude was further increased until the upper comfortable limit (UCL) was found. At each step, eye movement responses were measured and the patient’s perception was collected. The comparison among different settings with equal amplitude was made at the highest level measured in each group of three measurements (indicated by the dotted magenta colored line).

