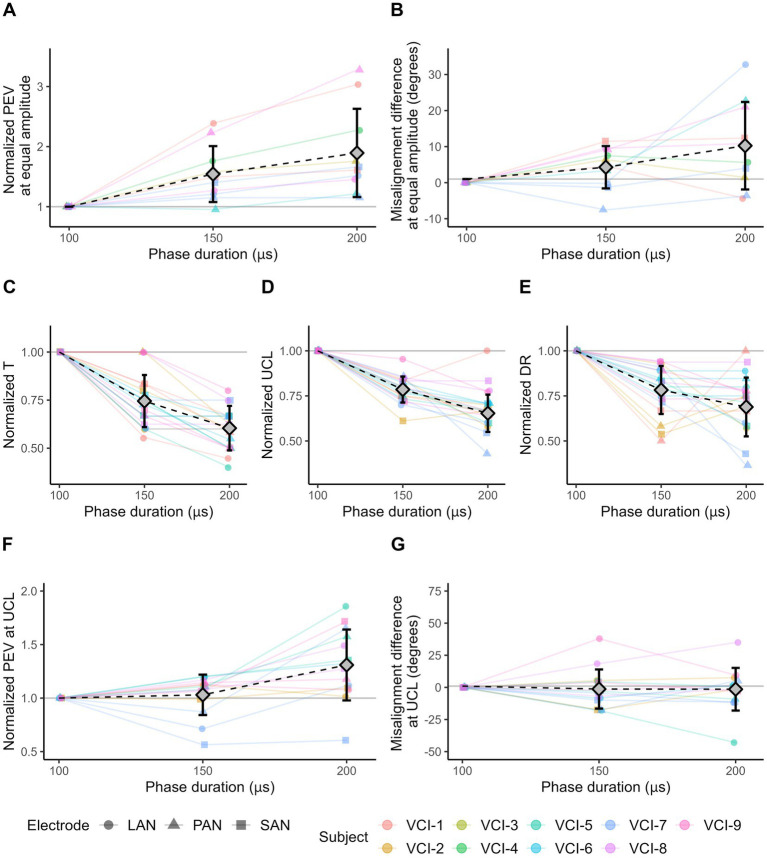
Figure 4.
VI response characteristics as a result of 2 s block stimuli with different phase duration values. Responses evoked with a phase duration of 100 μs are used as reference value for normalization. Diamonds represent mean values, error bars indicate one standard deviation. (A) The normalized PEV measured in each electrode with three phase duration settings. For each subject/electrode/experiment combination, the amplitude was equal and was chosen at the highest level measured in all three settings. (B) Misalignment difference of the responses shown in (A). (C) Normalized threshold (T) amplitude levels. (D) Normalized amplitude of upper comfortable limits (UCL). (E) Normalized dynamic ranges (DR). (F) Normalized PEV at the upper comfortable limit (UCL). UCL can differ within subject/electrode series. (G) Misalignment difference at the upper comfortable limit (UCL). (A,B,F,G) Only electrodes showing eVOR responses (PEV >30 °/s) in all three conditions are displayed.

