
Figure 4.
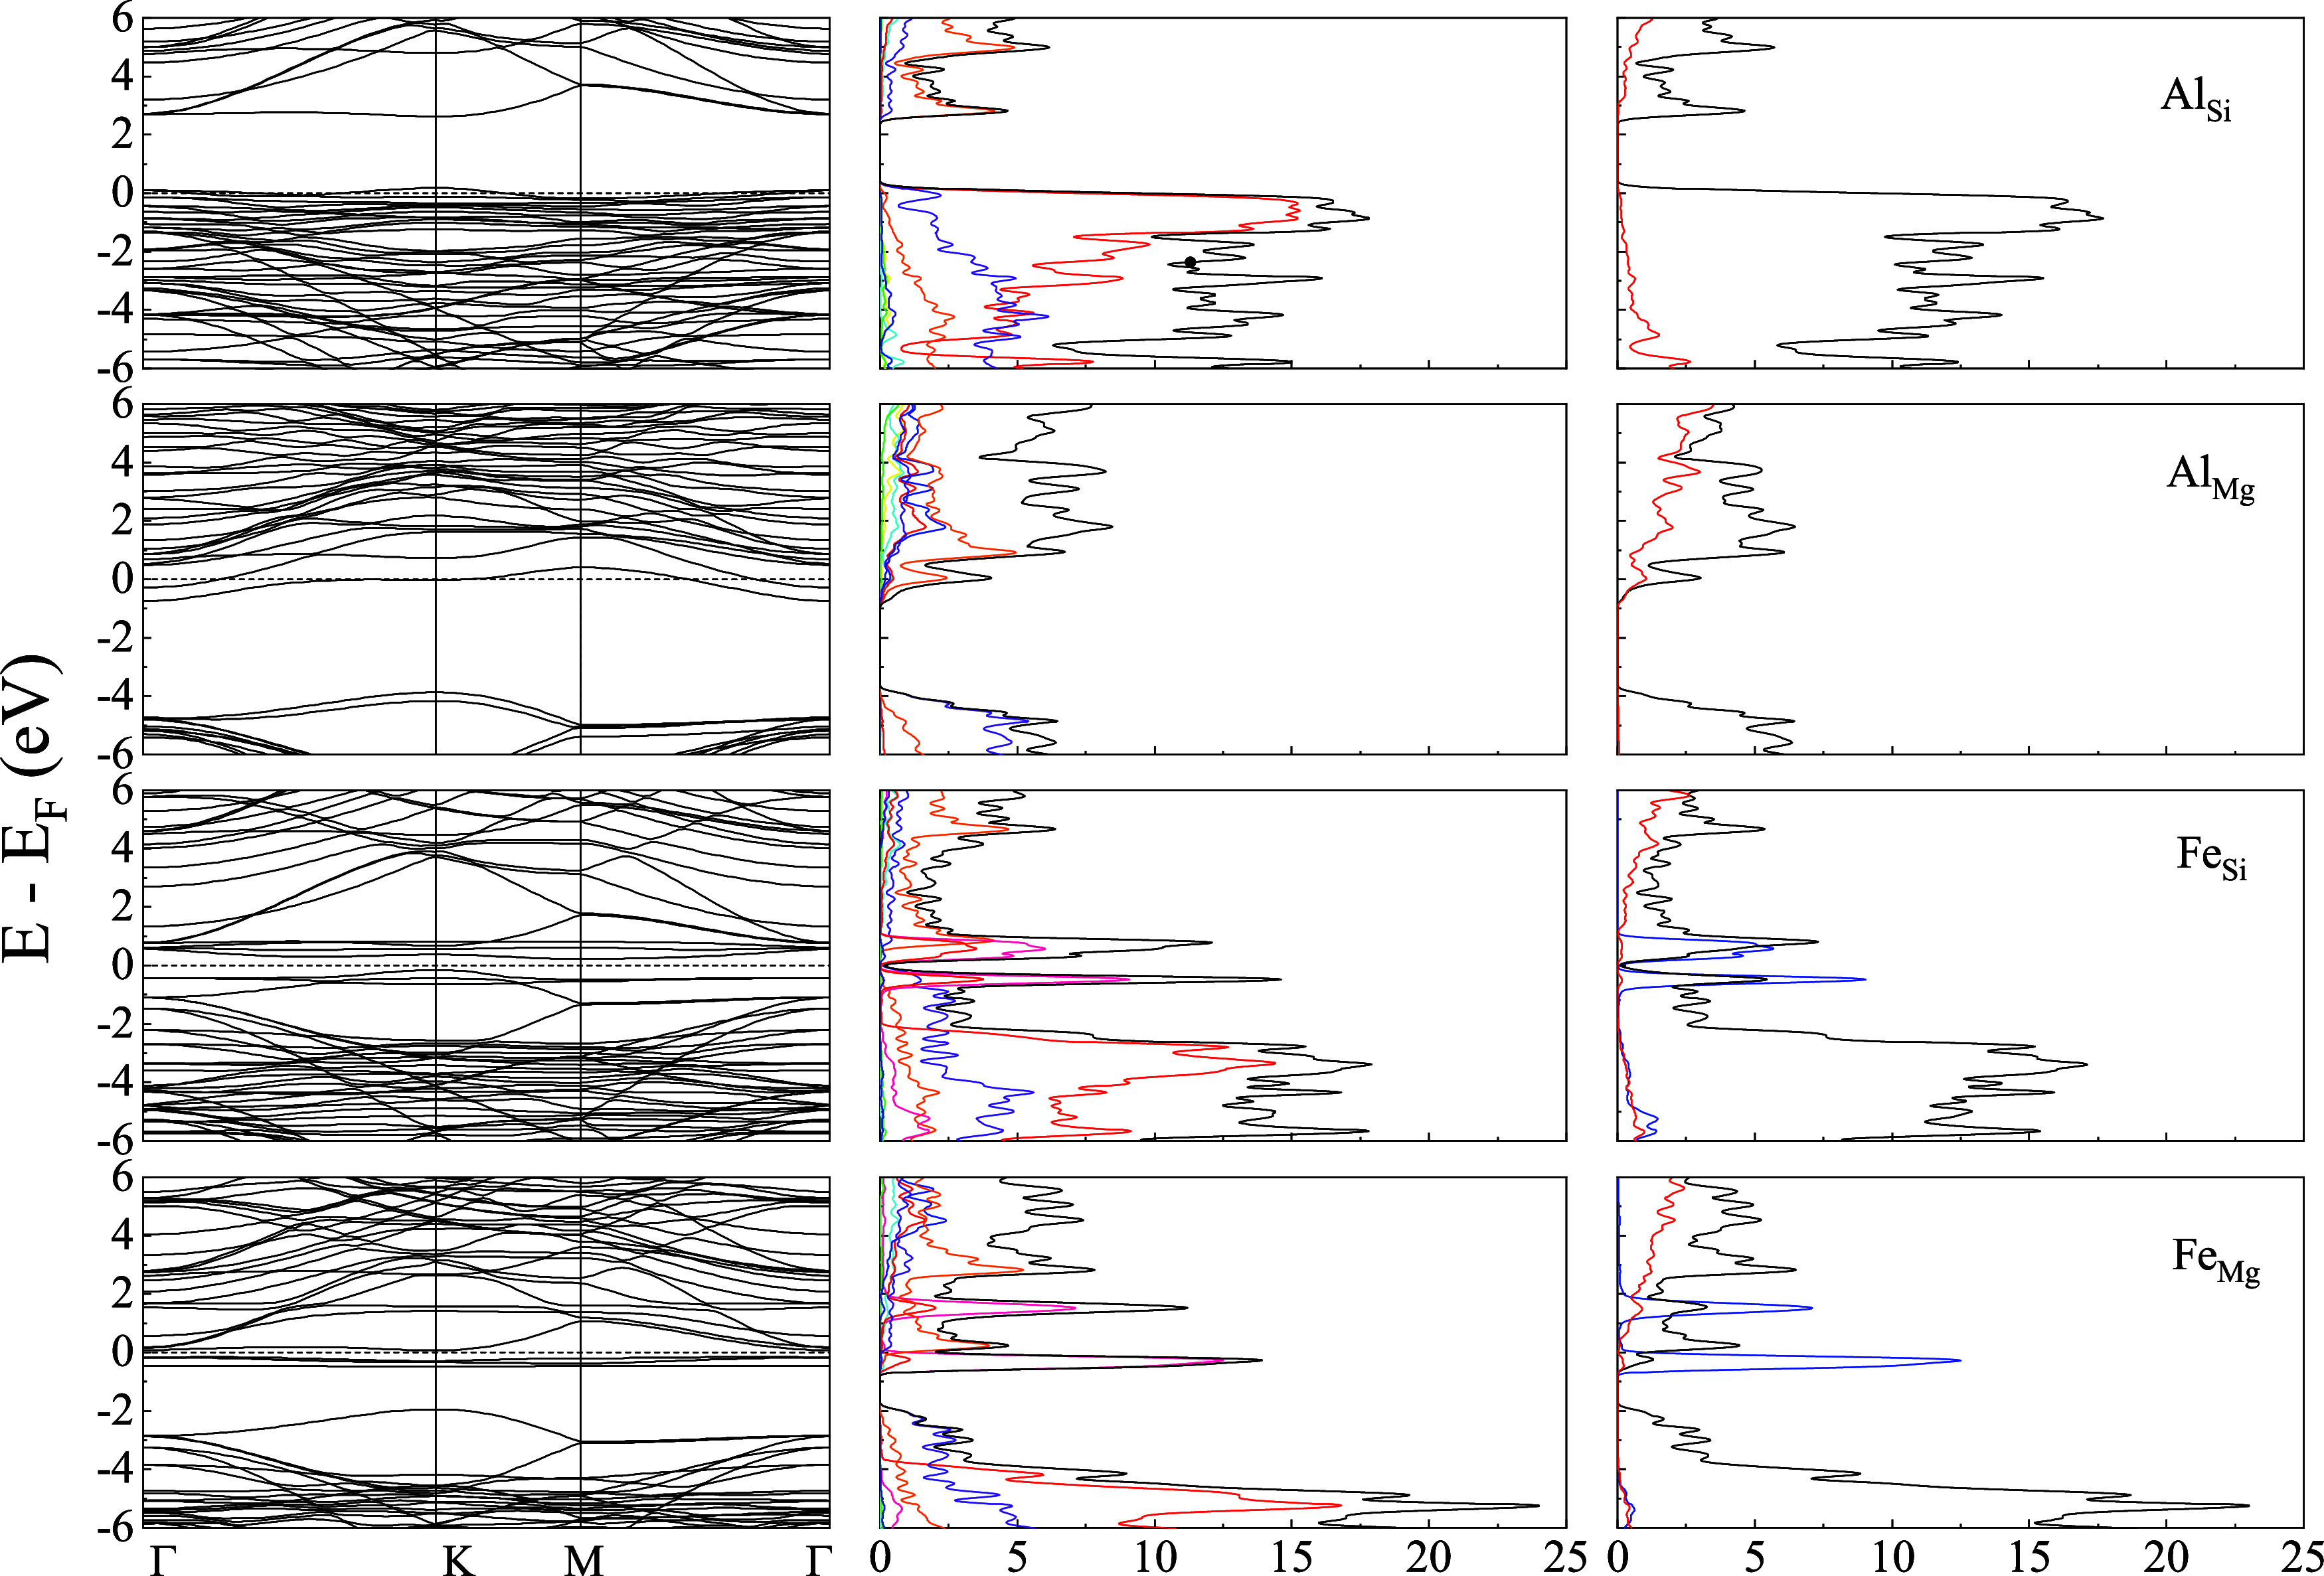
Energy bands (column 1), the projected density of states of the atoms (column 2), and the orbital-resolved PDOS (column 3) of Liz-hBN3 in the presence of impurities Al/Fe for the cases of AlSi, AlMg, FeSi, and FeMg as represented in the figures. Column 2 shows the contributions from Mg (green), Si (blue), O (red), H (cyan), B (orange), N (violet), Al (yellow), and Fe (violet), whereas column 3 has the contributions from s-wave (red line), p-wave (black line), and d-wave (blue line). The Fermi energy is shown by the dotted line in the first column of the figure.