FIGURE 3.

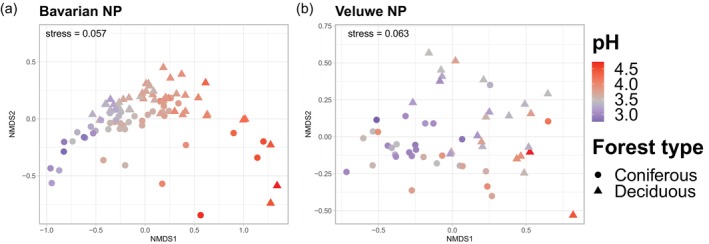
NMDS plot based on the Bray–Curtis dissimilarity of bacterial communities at the ASV level (Hellinger‐transformed reads) in Bavarian NP (a) and Veluwe NP (b). Soil samples are coloured by pH values.

NMDS plot based on the Bray–Curtis dissimilarity of bacterial communities at the ASV level (Hellinger‐transformed reads) in Bavarian NP (a) and Veluwe NP (b). Soil samples are coloured by pH values.