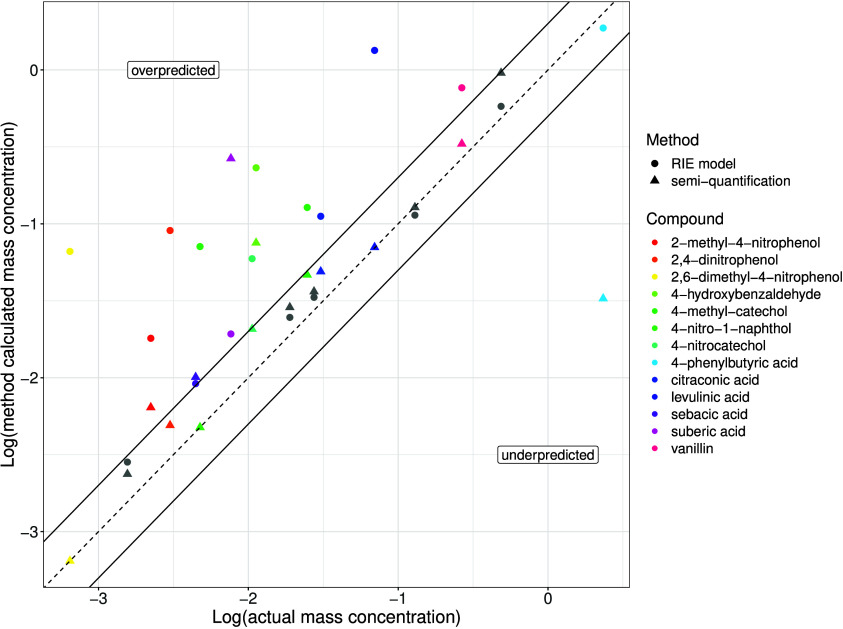
Figure 2.
Comparison of semi-quantification (triangle markers) and RIE predictive model (circle markers) methodologies (y axis) with authentic standards (x axis) for the quantification of identified compounds, shown as average concentrations (μg m–3), within the wood burning aerosol samples. The 1:1 line is presented as a dashed line, and the 1:2 and 2:1 lines are indicated by the solid lines. Compounds within a factor of 2 from the authentic standard concentration in both methods are shown as gray markers. Compounds which do not meet this condition are presented in color.

