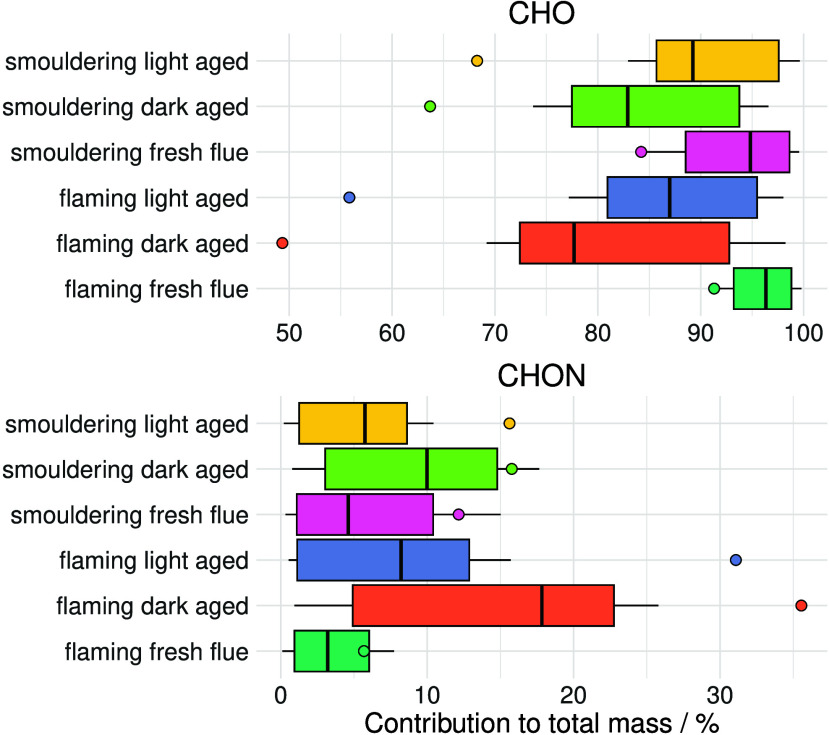
Figure 3.
Percentage contribution of CHO and CHON compounds to the total mass concentration within laboratory-generated wood burning aerosol, colored by different conditions. The box plot represents the relative abundance determined from quantification using the median, lower quartile, upper quartile, minimum, and maximum calibration gradients for each compound in each retention time window. The points represent the relative abundance derived using peak area.

