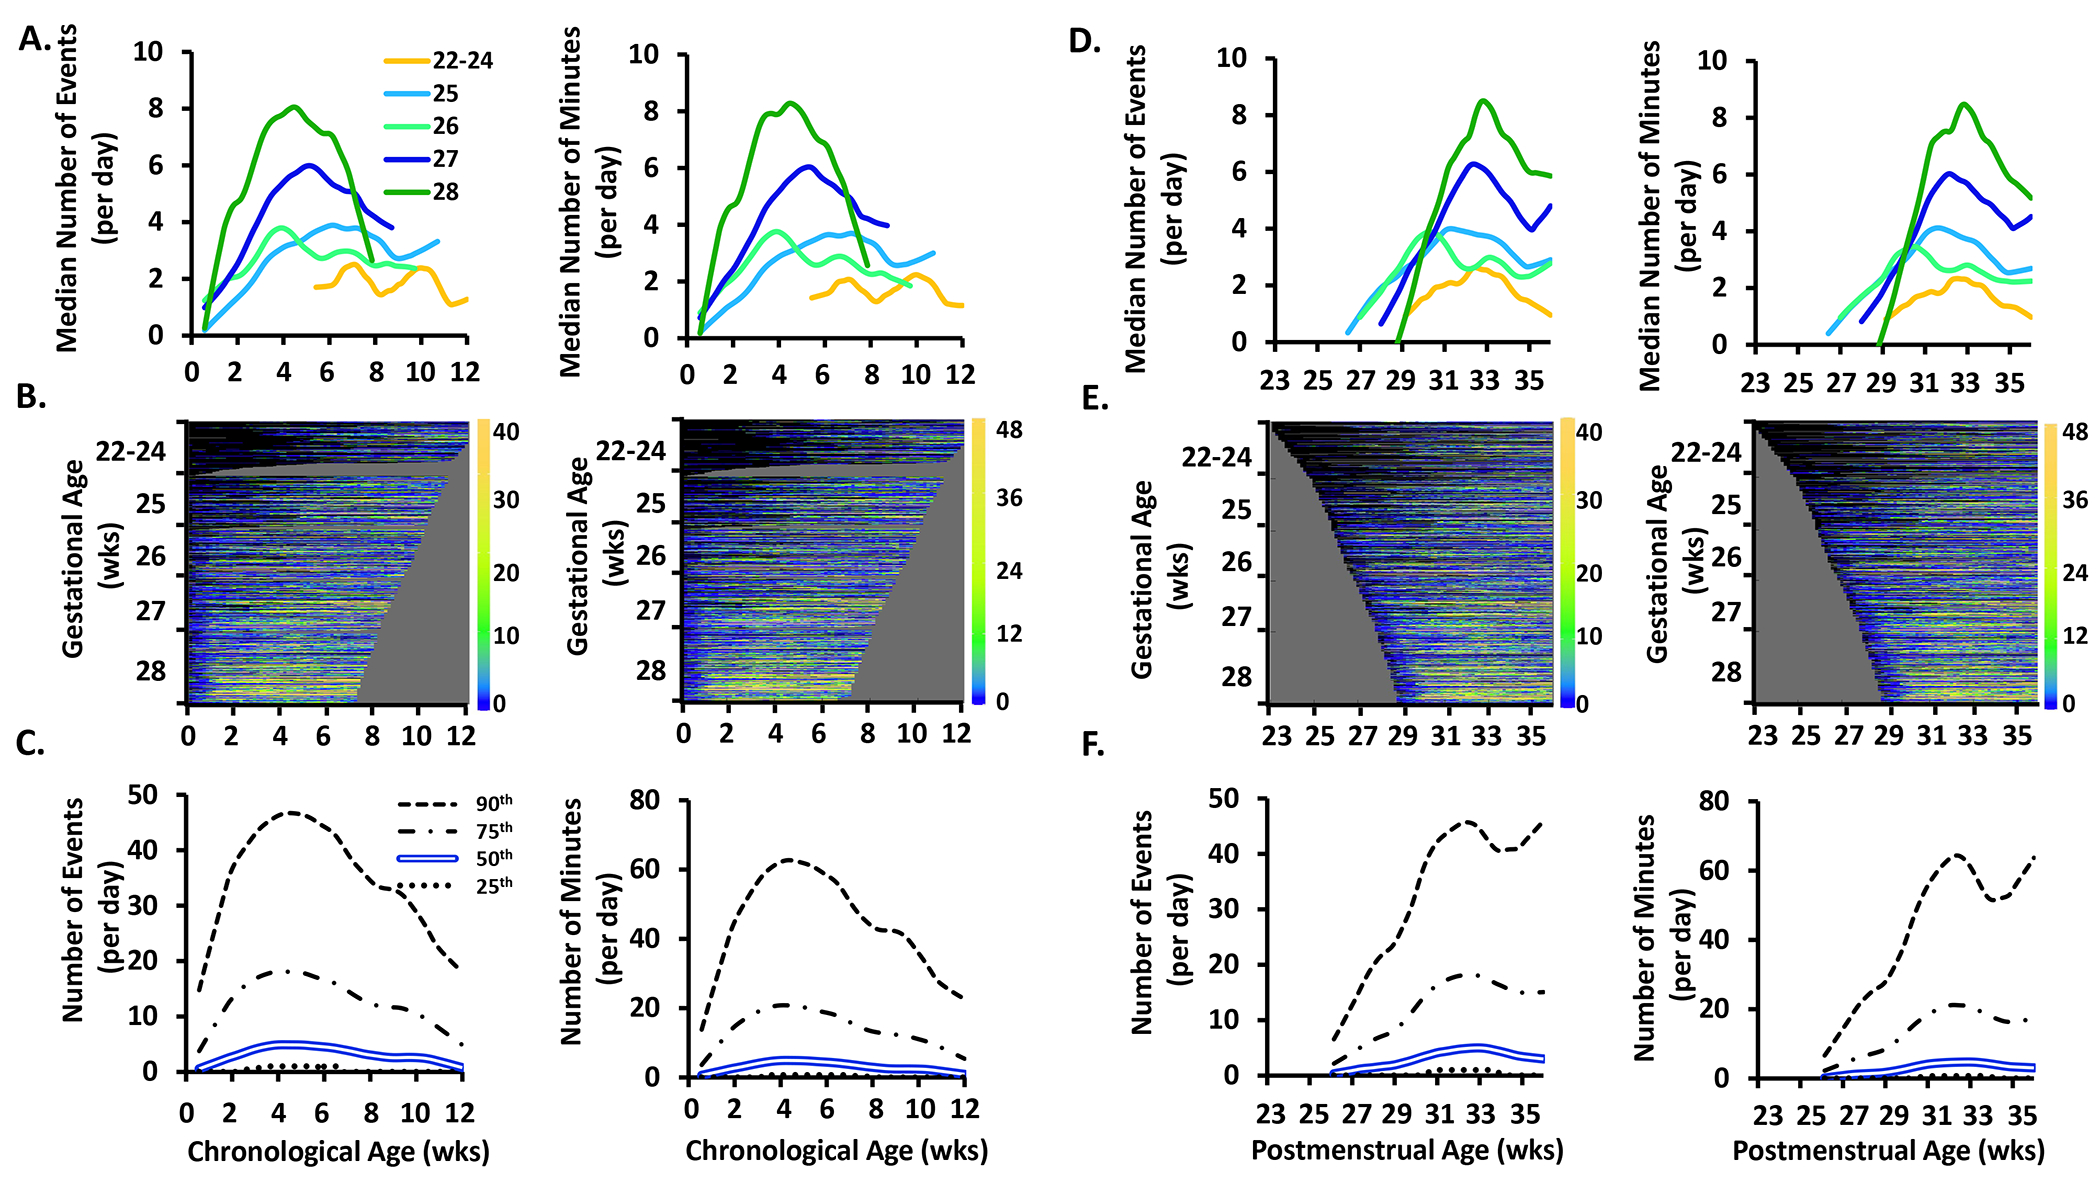
Figure 2.

The frequency (number of events/day) and exposure (number of minutes/day) of periodic breathing events by chronological age, postmenstrual age, and gestational age. See Figure 1 for further details of each row. Yellow is more prominent at the bottom of the heat map signifying that less premature infants have more periodic breathing than more premature infants.
