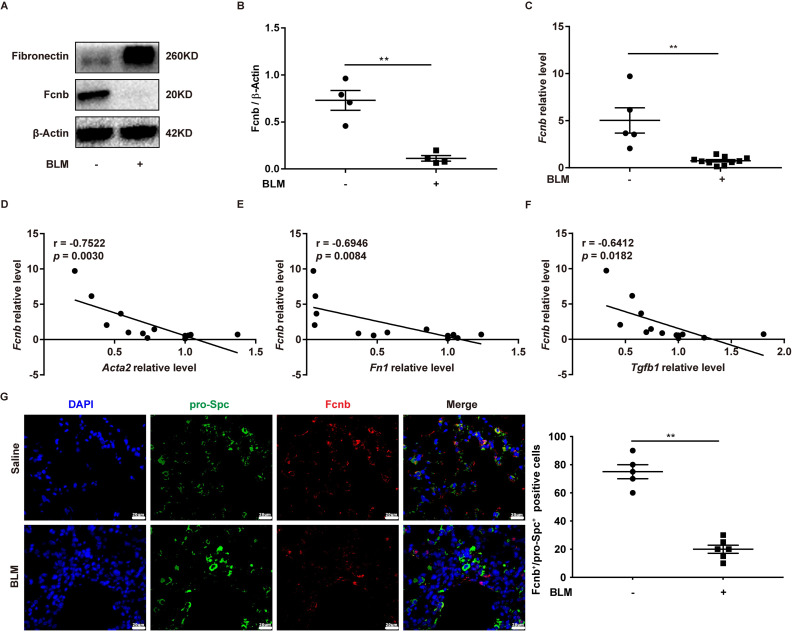
Fig. 2.
Expression of Fcnb in pulmonary fibrosis mice with bleomycin (BLM) induction. (A-B) Western blot analysis of Fcnb and fibronectin expression in the lungs of mice after BLM induction (n = 4 per group). (C) RT-PCR analysis of Fcnb in the lungs of mice after BLM treatment (n = 6–12 per group). (D-F) RT-PCR analysis of the correlation between Fcnb and D) Acta2, F) Fn1, F) Tgfb1 expression after BLM induction (n = 12 per group). (G) Representative results for co-immunostaining of Fcnb and pro-Spc (alveolar epithelium marker) in lung sections from BLM-induction mice. The nuclei were stained blue using 4′,6-diamidino-2-phenylindole (DAPI), and the images were taken under original magnification ×400. Data are presented as mean ± SEM. *p < 0.05, **p < 0.01, ***p < 0.001 by student’s unpaired t-test (B and C). Fcnb, ficolin-B

