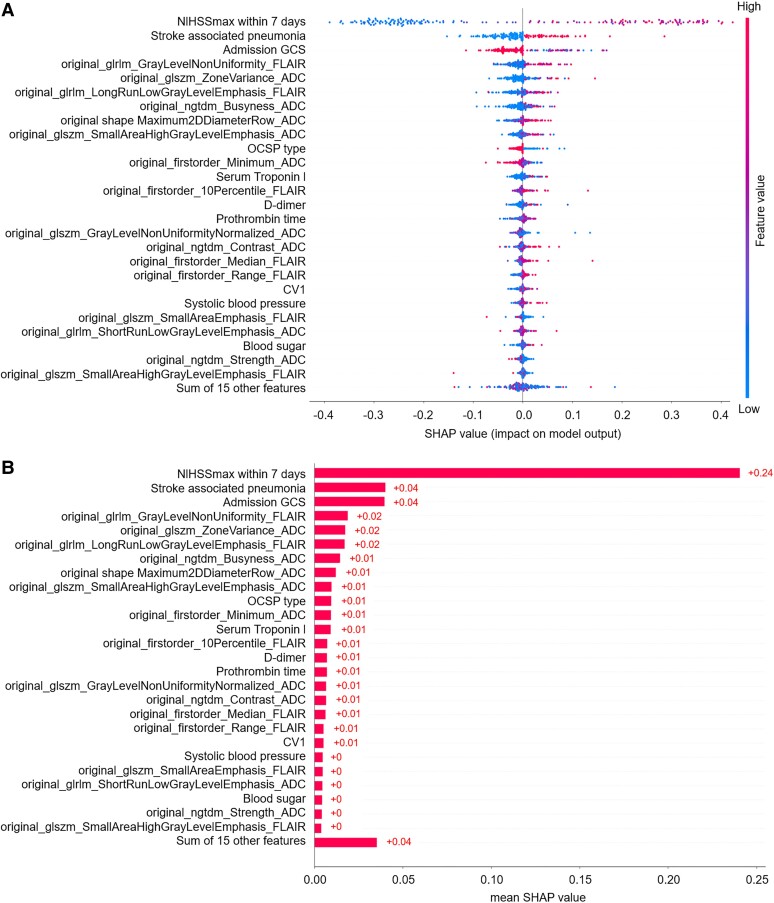
Figure 3.
SHAP beeswarm charts and global bar plots of the prognostic prediction model based on mask DWI. (A) SHAP beeswarm chart of mask DWI shows SHAP values of each feature as scatter. (B) SHAP global bar plots of mask DWI shows the averaged SHAP values of each feature, which indicate the importance of each feature in the model. CRP, C-reactive protein; CV, coefficient of variation; glcm, grey-level cooccurrence matrix; gldm, grey-level difference matrix; glrlm, grey-level run-length matrix; glszm, grey-level size zone matrix; ngtdm, neighbourhood grey-tone difference matrix.

