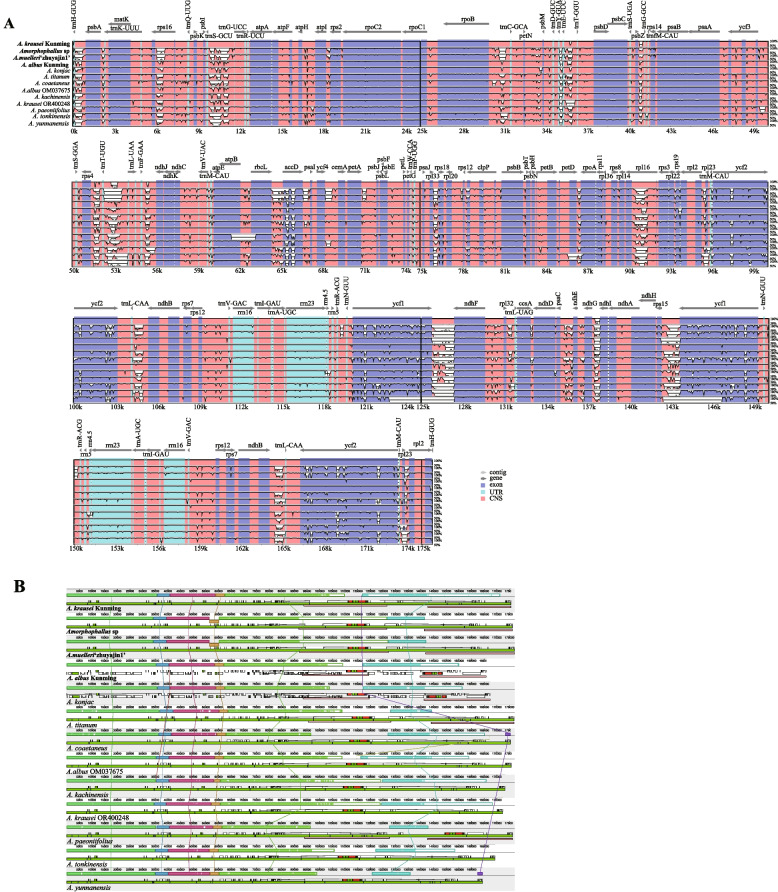
Fig. 6.
Comparison of the chloroplast genome sequences of 13 Amorphophallus species. A Sequence variation analysis generated with mVISTA. Gray arrows indicated the position and direction of each gene. Purple, blue, pink, and gray bars represent exons, untranslated regions (UTRs), non-coding sequences (CNS), and mRNA, respectively. The scales on the Y-axis represent the average percent identity of sequence similarity ranging from 50 to 100%. B Collinear block analyses of Amorphophallus genome. The white, black, green and colours blue represent protein-coding genes, tRNA genes, intron containing tRNA genes, and rRNA genes, respectively. The species in bold are sequenced in this study

