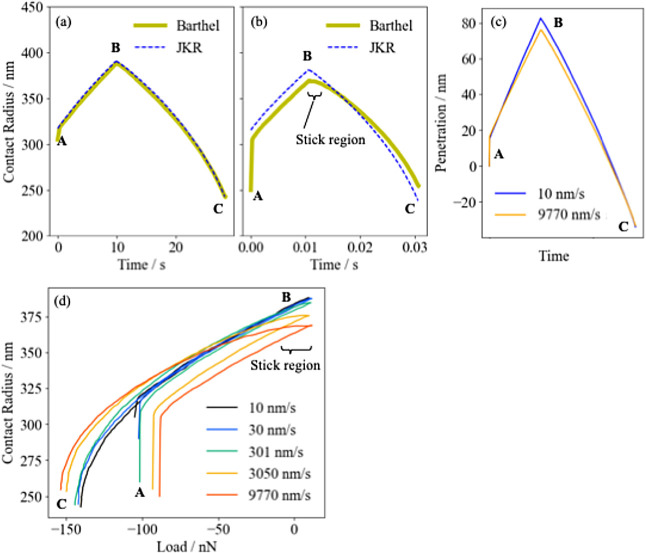
Figure 3.
Time variation of the contact radius for the ramp rate of (a) 10 and (b) 9770 nm/s. Thick solid yellow lines and thin dashed blue lines represent the contact radius from the Barthel and JKR models, respectively. (c) shows the time variation of the penetration corresponding to (a,b). (d) shows the relationship between load and contact radius under various ramp rates.

