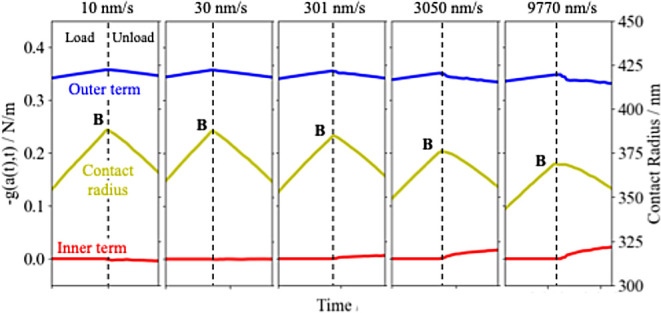
Figure 5.

Components of g(a(t),t) in the vicinity of the “stick region” for various ramp rates. The red and blue lines represent components originating from the contact area and the interaction zone, respectively. The yellow lines represent the contact radius.
