
Fig 3.
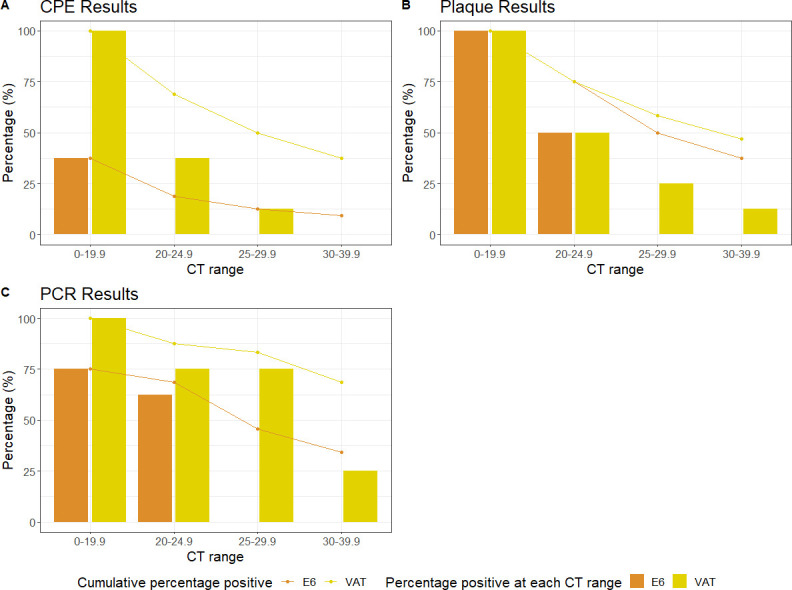
The percentage of positive results according to the different Ct ranges in viral passage 1 using the three detection methods. (A) CPE, (B) plaque assay, and (C) RT-qPCR. CPE, cytopathic effect.
Official websites use .gov
A
.gov website belongs to an official
government organization in the United States.
Secure .gov websites use HTTPS
A lock (
) or https:// means you've safely
connected to the .gov website. Share sensitive
information only on official, secure websites.
The percentage of positive results according to the different Ct ranges in viral passage 1 using the three detection methods. (A) CPE, (B) plaque assay, and (C) RT-qPCR. CPE, cytopathic effect.