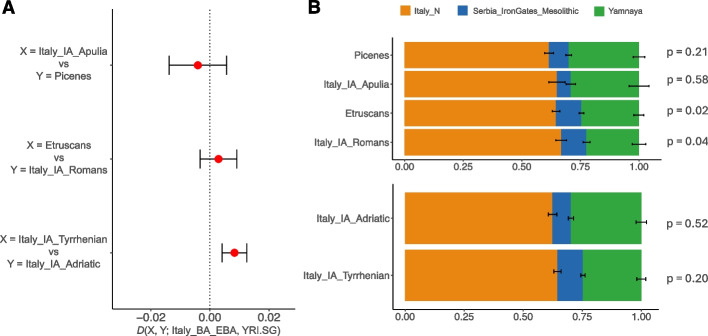
Fig. 3.
Genetic affinity and modeling of the Italic IA populations. A D-statistics in the form D(X,Y; Italy_BA_EBA; YRI.SG), where X and Y are Italic IA groups. If D > 0, the Italian BA individuals (Italy_BA_EBA) are more closely related to population X, while if D < 0, Italy_BA_EBA is more closely related to population Y. In the first two tests, comparisons between Italic groups on the same side of the peninsula (Italy_IA_Apulia vs Picenes; Etruscans vs Italy_IA_Romans) are represented; the third test shows the comparison between all the Tyrrhenian vs all the Adriatic IA populations. B qpAdm with 3 source populations for the Italic IA groups. Above, Italic IA ethnic groups analyzed so far. Below, Italic IA Adriatic and Tyrrhenian populations grouped together. For each model, p-values are reported

