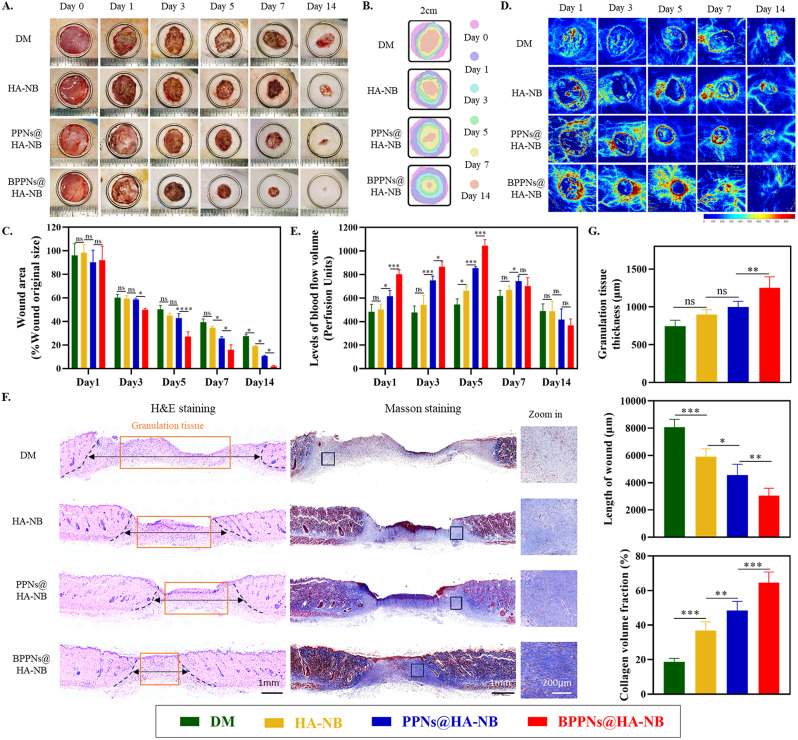
Fig. 6.
In vivo evaluation of BPPNs in the diabetic rat full-thickness wounds model. (A) Representative photographic images of the wounds healing process with different treatments on day 0, 1, 3, 5, 7 and 14. (B) Traces of wound-bed closure during 14 days for each treatment. (C) percentage of wound area after treatment with the different preparations on day 1, 3, 5, 7 and 14. (D) Representative Laser Doppler scan images on the diabetic wound after treatment on day 0, 1, 3, 5, 7 and 14. (E) Quantification of blood flow volume at day 1, 3, 5, 7 and 14 using moorLDI Review V6.1 software. (F) H&E and masson staining evaluation of wound regeneration after treatment with the different preparations on the 14th day. The black dashed line show the border between the wound tissue and surrounding healthy skin tissue. (G) Quantification of granulation tissue thicknesses, the length of wound and collagen volume fraction for different treatments on the 14th day. n = 5, *P < 0.05, **P < 0.01, ***P < 0.005

