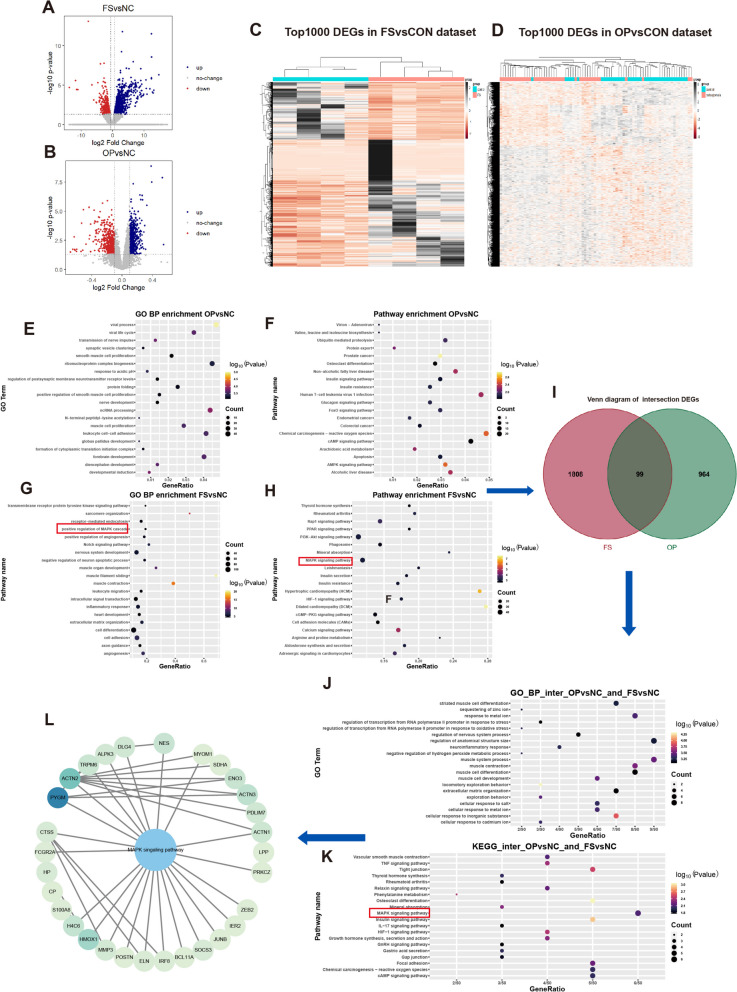
Fig. 2.
Gene expression change during the pathological process of FS and OP. A, B The volcano plot of different expression genes in frozen shoulder (FS) group compared with control group (NC) and osteoporosis (OP) compared with control group (NC). The volcano plot was constructed with fold-change values (log2 scale) and p values (-log10 scale). The vertical lines were corresponding with the log2 fold change of log21.5 in A and log21.1 in B. The horizontal line represents with a p value of 0.05 in both A and B. C, D The heatmap of the top 1000 DEGs in FS and OP dataset. E Top 20 GO BP terms of DEGs in FS dataset. The positive regulation of MAPK cascade was involved. F Top 20 GO BP terms of DEGs in OPdataset. G Top 20 KEGG pathways of DEGs in FS dataset. H Top 20 KEGG pathways of DEGs in OP dataset. I The Venn diagram of intersection of FS and OP DEGs. J Top 20 KEGG pathways of intersection DEGs. K Top 20 GO BP terms of intersection DEGs. L The PPI network analysis of intersection DEGs. The shade of color represented the MCODE betweeness score and the MAPK singaling pathway took over the core regulation in crosstalk genes

