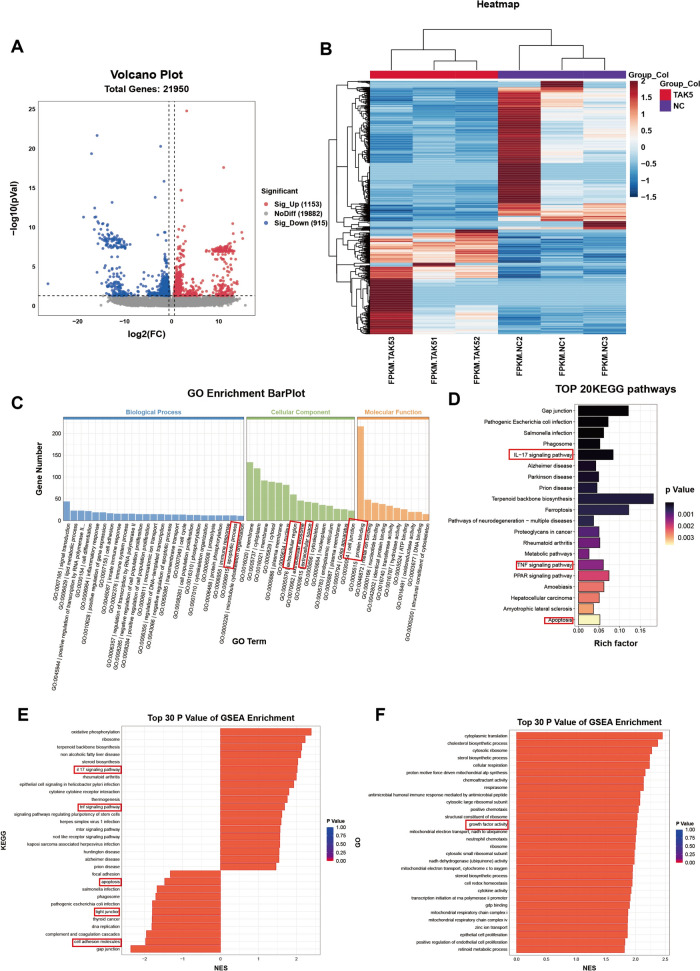
Fig. 5.
Gene expression after the treatment of TAK715. A The volcano plot of different expression genes after the TAK715 treatment at 5 μM in FS synovial fibroblasts. The untreated FS synovial fibroblast was set as control group (NC) and the FS synovial fibroblasts that were treated with 5 μM TAK715 (TAK5) was set as compared group. The volcano plot was constructed with fold-change values (log2 scale) and p values (-log10 scale). The vertical lines were corresponding with the |log2 fold change |of log22 and the horizontal line represents with a p value of 0.05. B The heatmap of the top 1000 DEGs in this gene set. C The GO Enrichment BarPlot of DEGs (ranked by enriched gene numbers). The terms that we focused were highlight. In top20 biological process, the apoptotic process (GO:0006915) was included. In top10 Cellular Component, the extracellular region (GO:0005576), extracellular space (GO:0005615) and cell junction (GO:0030054) were included. In Molecular Function, the protein binding (GO:0005515) was included. D The top20 KEGG pathways (ranked by p.value). The terms that we focused were highlight. The IL-17 signaling pathway (hsa04657), TNF signaling pathway (hsa04668) and apoptosis (hsa04210) were included. E, F The top 30 P Value of GSEA Enrichment analysis in KEGG and GO. The pathways or terms that we focused were highlighted. NES: normalized enrichment score

