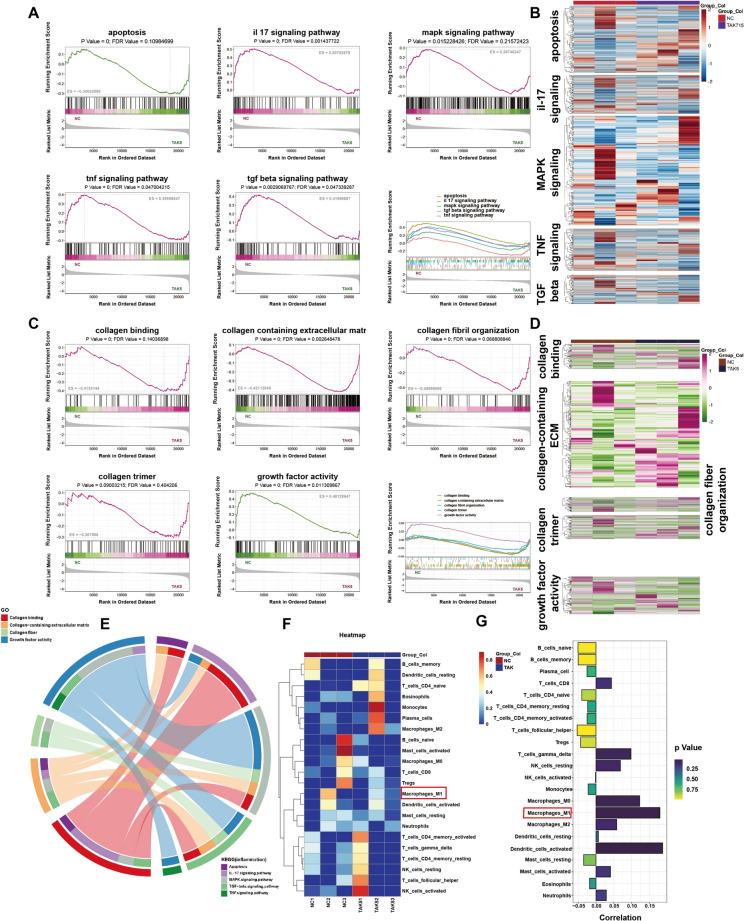
Fig. 6.
GSEA and immune infiltration analysis after TAK715 treatment. A The selected KEGG GSEA analysis ES diagram: apoptosis (pathway ID: hsa04210), TNF (pathway ID: hsa04668), IL-17 (pathway ID: hsa04657), MAPK signaling pathway (pathway ID: hsa04010) and TGF-beta signaling pathway (pathway ID: hsa04010). The combined ES diagram was at last. B The combined heatmap of selected pathways in KEGG GSEA analysis. C The selected GO GSEA analysis ES diagram: The collagen binding (GO:0005518), collagen-containing extracellular matrix (GO:0062023), collagen fiber organization (GO:0030199), growth factor activity (GO:0008083) and collagen trimer (GO:0005581). The combined ES diagram was at last. D The combined heatmap of selected pathways in KEGG GO analysis. E The inflammation-collagen interaction chord gram showed that the collagen terms and inflammation pathways are tightly linked. The value between term and pathway was calculated according to the log2 fold change of common genes. F The heatmap of different immune-cell gene expression in this gene set. The M1 macrophage related genes were more expressed in untreated FS synovial fibroblasts (NC group) compared with TAK715 treated (TAK5 group). G The correlation and p value of immune infiltration result. The M1 macrophage cluster exhibited the correlation of 0.18 and p value of 0.32, which indicated that the M1 macrophage infiltration was positive linked with the FS synovial fibroblasts

