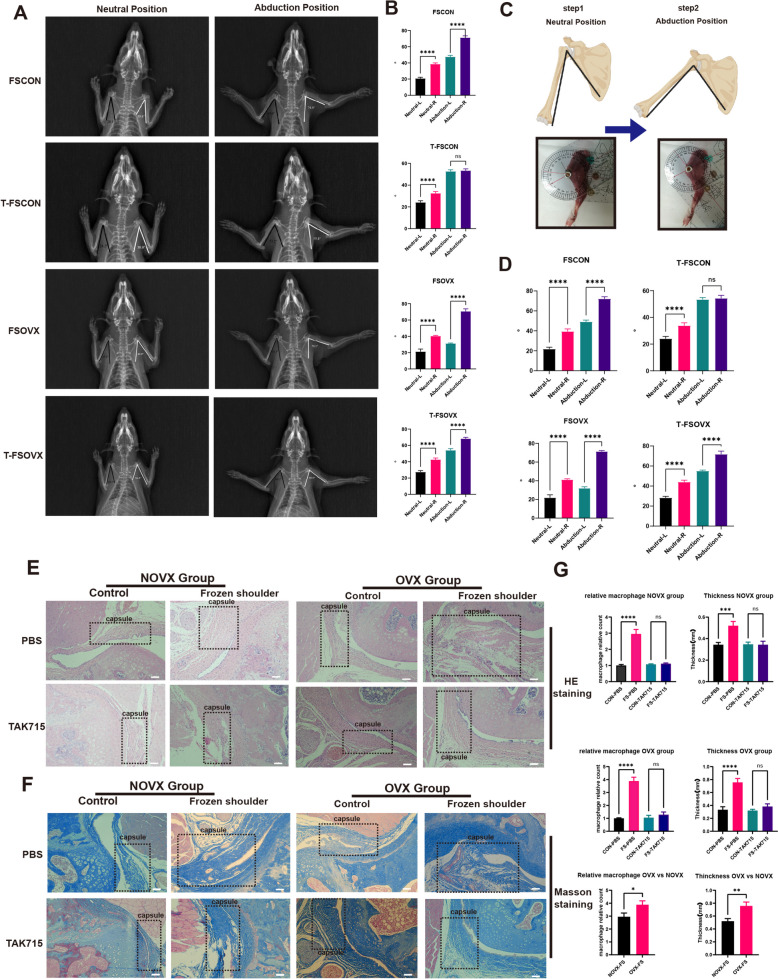
Fig. 7.
the X-ray images (A, B), ROM measurement (C, D) and histology analysis of FS rat models. A, B The X-rays of FS rats in neutral and abduction position and the statistics analysis of angle measurement in (A). (n = 6) *P < 0.05; **P < 0.01; *** P < 0.001; **** P < 0.0001. C, D The ROM measurement of FS rats in neutral and abduction position and the statistics analysis of ROM measurement in (A). (n = 6) *P < 0.05; **P < 0.01; *** P < 0.001; **** P < 0.0001. E Representative hematoxylin and eosin-stained (H&E) tissue sections of the shoulder joint. The capsule regions were encircled in dotted rectangle. Scale Bar: 100 μM. F Representative masson-stained tissue sections of the shoulder joint. The capsule regions were encircled in dotted rectangle. Scale Bar: 100 μM. G The statistics analysis of capsular thickness(mm) and macrophage relative counts in (E). (n = 3) *P < 0.05; **P < 0.01; *** P < 0.001; **** P < 0.0001

