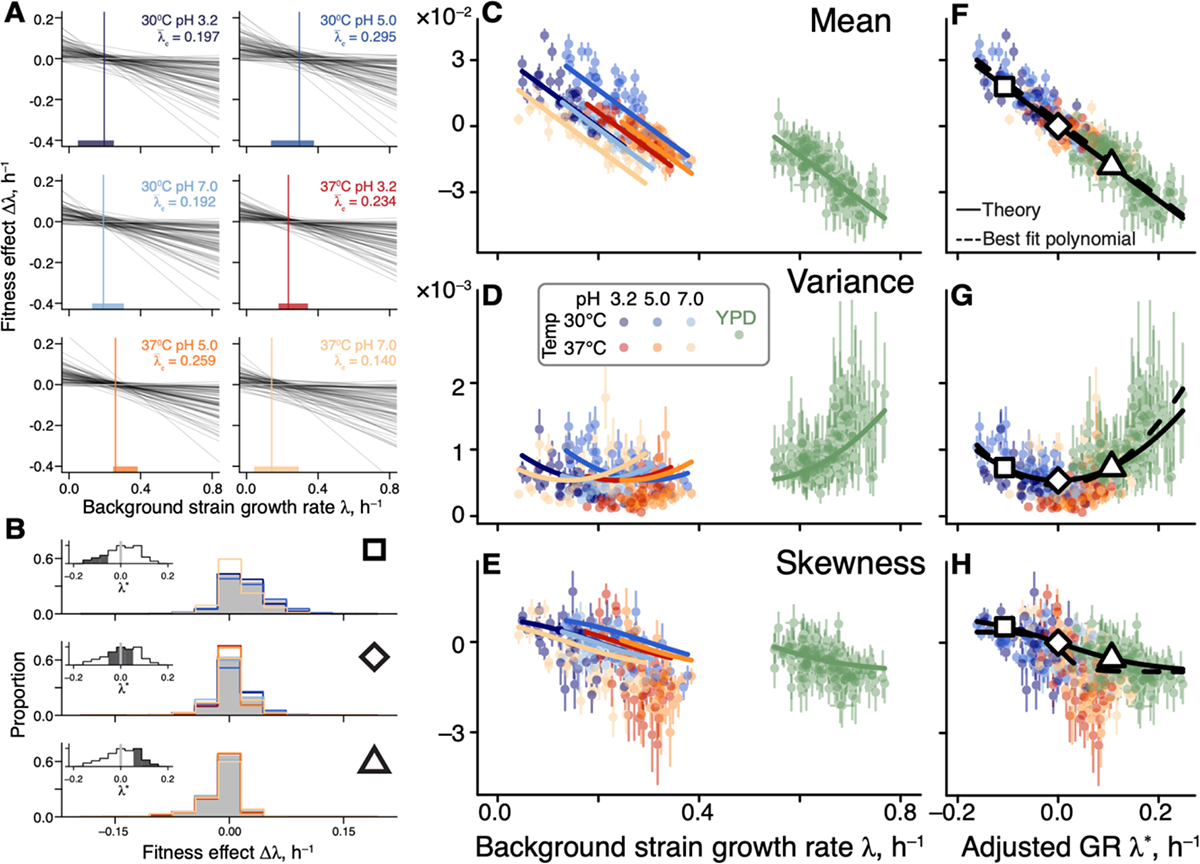
Figure 4. Generalized global epistasis equation captures changes in the DFE across strains and environments.

A. The global epistasis contribution to the fitness effect of each mutation (term in equation (2)) as a function of background growth rate term . Each line represents a mutation. Vertical line indicates the pivot growth rate. Thick colored lines on the -axis indicate the range of measured background-strain growth rates in each environment. B. Estimated DFEs for strains whose adjusted growth rate is negative (top panel), approximately zero (middle panel) and positive (bottom panel). Gray bars show DFEs pooled across all environments, colored lines show DFEs for individual environments (colors are as in previous figures). Insets show the distributions of adjusted growth rates for background strains, with the focal bin shaded. Large square, rhombus and triangle are shown for reference with panels F,G,H. C, D, E. DFE moments plotted against the background strain growth rate. Error bars show ±1 standard errors (see (45), Section 1.3.9). Solid curves show the theoretical predictions calculated from equation (2) and parameterized without the YPD data (see (45), Section 1.4). DFE moments are calculated with a median of 74 mutations (interquartile interval [61,79]). F, G, H. Same data as in C, D, E, but plotted against the adjusted growth rate. Dashed curves are the best fitting polynomial of the corresponding degree (see (45), Section 1.4).
