Figure 3.
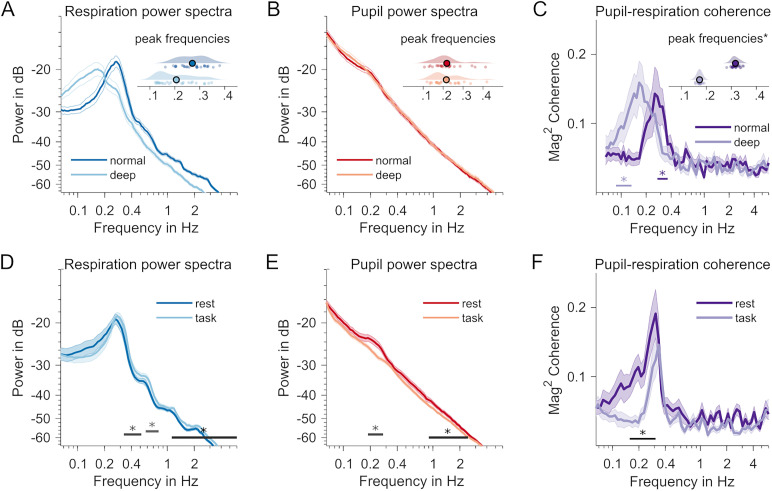
A, Contrasted normal versus deep breathing conditions (dark vs light colors in A–C). A marked decrease in respiration frequency. The inset raincloud plot shows individual distributions of peak frequencies (in Hz) in both conditions. Offset along the y-axis noninformative and for visualization only. B, Same as in A but for pupillary dynamics. No significant differences in hippus peak frequencies between normal and deep breathing. C, Individual coupling peak frequencies (*, variance-corrected jackknife estimates) are markedly reduced during deep breathing. Straight lines below spectra signify systematic coherence differences when compared with surrogate data (data not shown). D, Contrasted rest versus task conditions (different sample than A–C). Respiration power spectrum during rest (dark blue) and task performance (light blue). The straight lines with asterisks at the bottom of D–F indicate frequency ranges with significant changes between both behavioral states (p < 0.05, pairwise t-statistic, cluster-based permutation test). E, Same for power spectra of pupil time series; dark red, rest; light red, task. F, Comparison of respiration–pupil coupling, measured as magnitude-squared coherence. Dark purple, rest; light purple, task condition.

