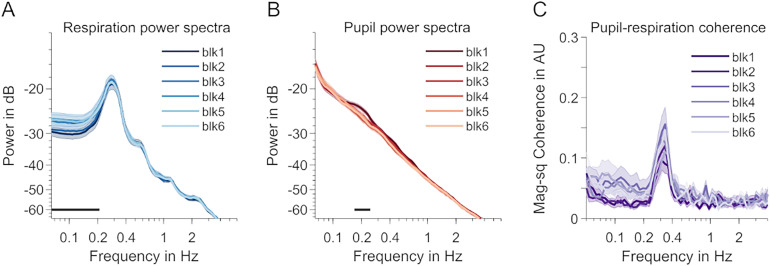
Figure 4.
Differences between task blocks. A, Respiration power spectra across the six blocks including task performance. Light colors indicate later blocks. The shaded areas indicate SEM. A straight black line above the x-axis indicates a frequency cluster with a significant time-on-task effect (linear regression, p < 0.05, cluster-based permutation test). B, Same as A but for pupil data. C, Same as A and B but for respiration–pupil coupling (magnitude-squared coherence). No significant differences in coherence between blocks.

