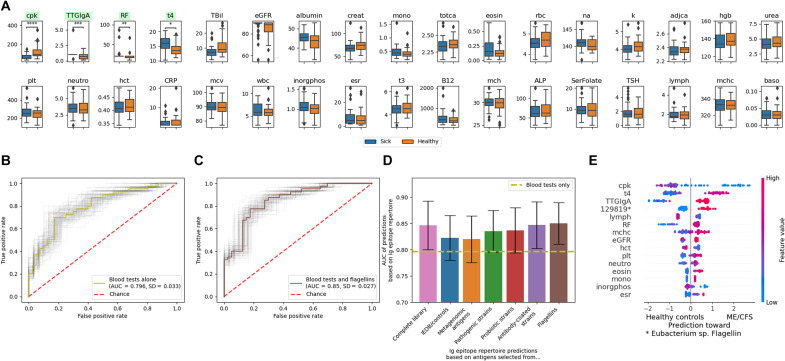
Fig. 4. Antibody responses against gut microbiota represent a unique layer of information beyond conventional blood tests, allowing for improved diagnosis of ME/CFS by machine learning algorithms.
(A) Blood test results of patients with severe ME/CFS and healthy controls. Significantly different (Mann-Whitney-Wilcoxon test with Bonferroni correction) tests are highlighted in green. Missing blood tests were removed from the comparisons. Mann-Whitney-Wilcoxon test two-sided results: U(Ncontrol = 40, NME/CFS = 40) = 291; P < 1 × 10⁻⁵). *P ≤ 0.05, **P ≤ 0.01, ***P ≤ 0.001, ****P ≤ 1.00 × 10−04. See Methods for details and table S4 for abbreviations used and a full description of the respective blood test markers. (B) Machine learning algorithms on blood tests alone allow to classify patients with severe ME/CFS from healthy controls. ROC with the light gray lines illustrating model variability by bootstrapping (as in Fig. 3A). (C and D) Addition of antibody repertoire data improves diagnosis compared to conventional blood tests alone. In (C), an ROC of the best-performing combination of antibody bound peptides and prevalence cutoffs is shown [error bars represent 95% CIs as in (B)]. (D) Summary of model performance trained on antibody responses against different subsets within the antigen library. See Methods for details on the subgroups of the antigen library. (E) SHAP analysis of the best-performing model [shown in (C)]. The top 15 contributing features are listed. See table S6 for a full list, and see Fig. 3C for an explanation of the SHAP analysis. Predictions in (C) to (E) were performed with XGB (61) and leave-one-out cross-validation on different prevalence cutoffs of antibody responses appearing in the cohorts (see Methods for details).

