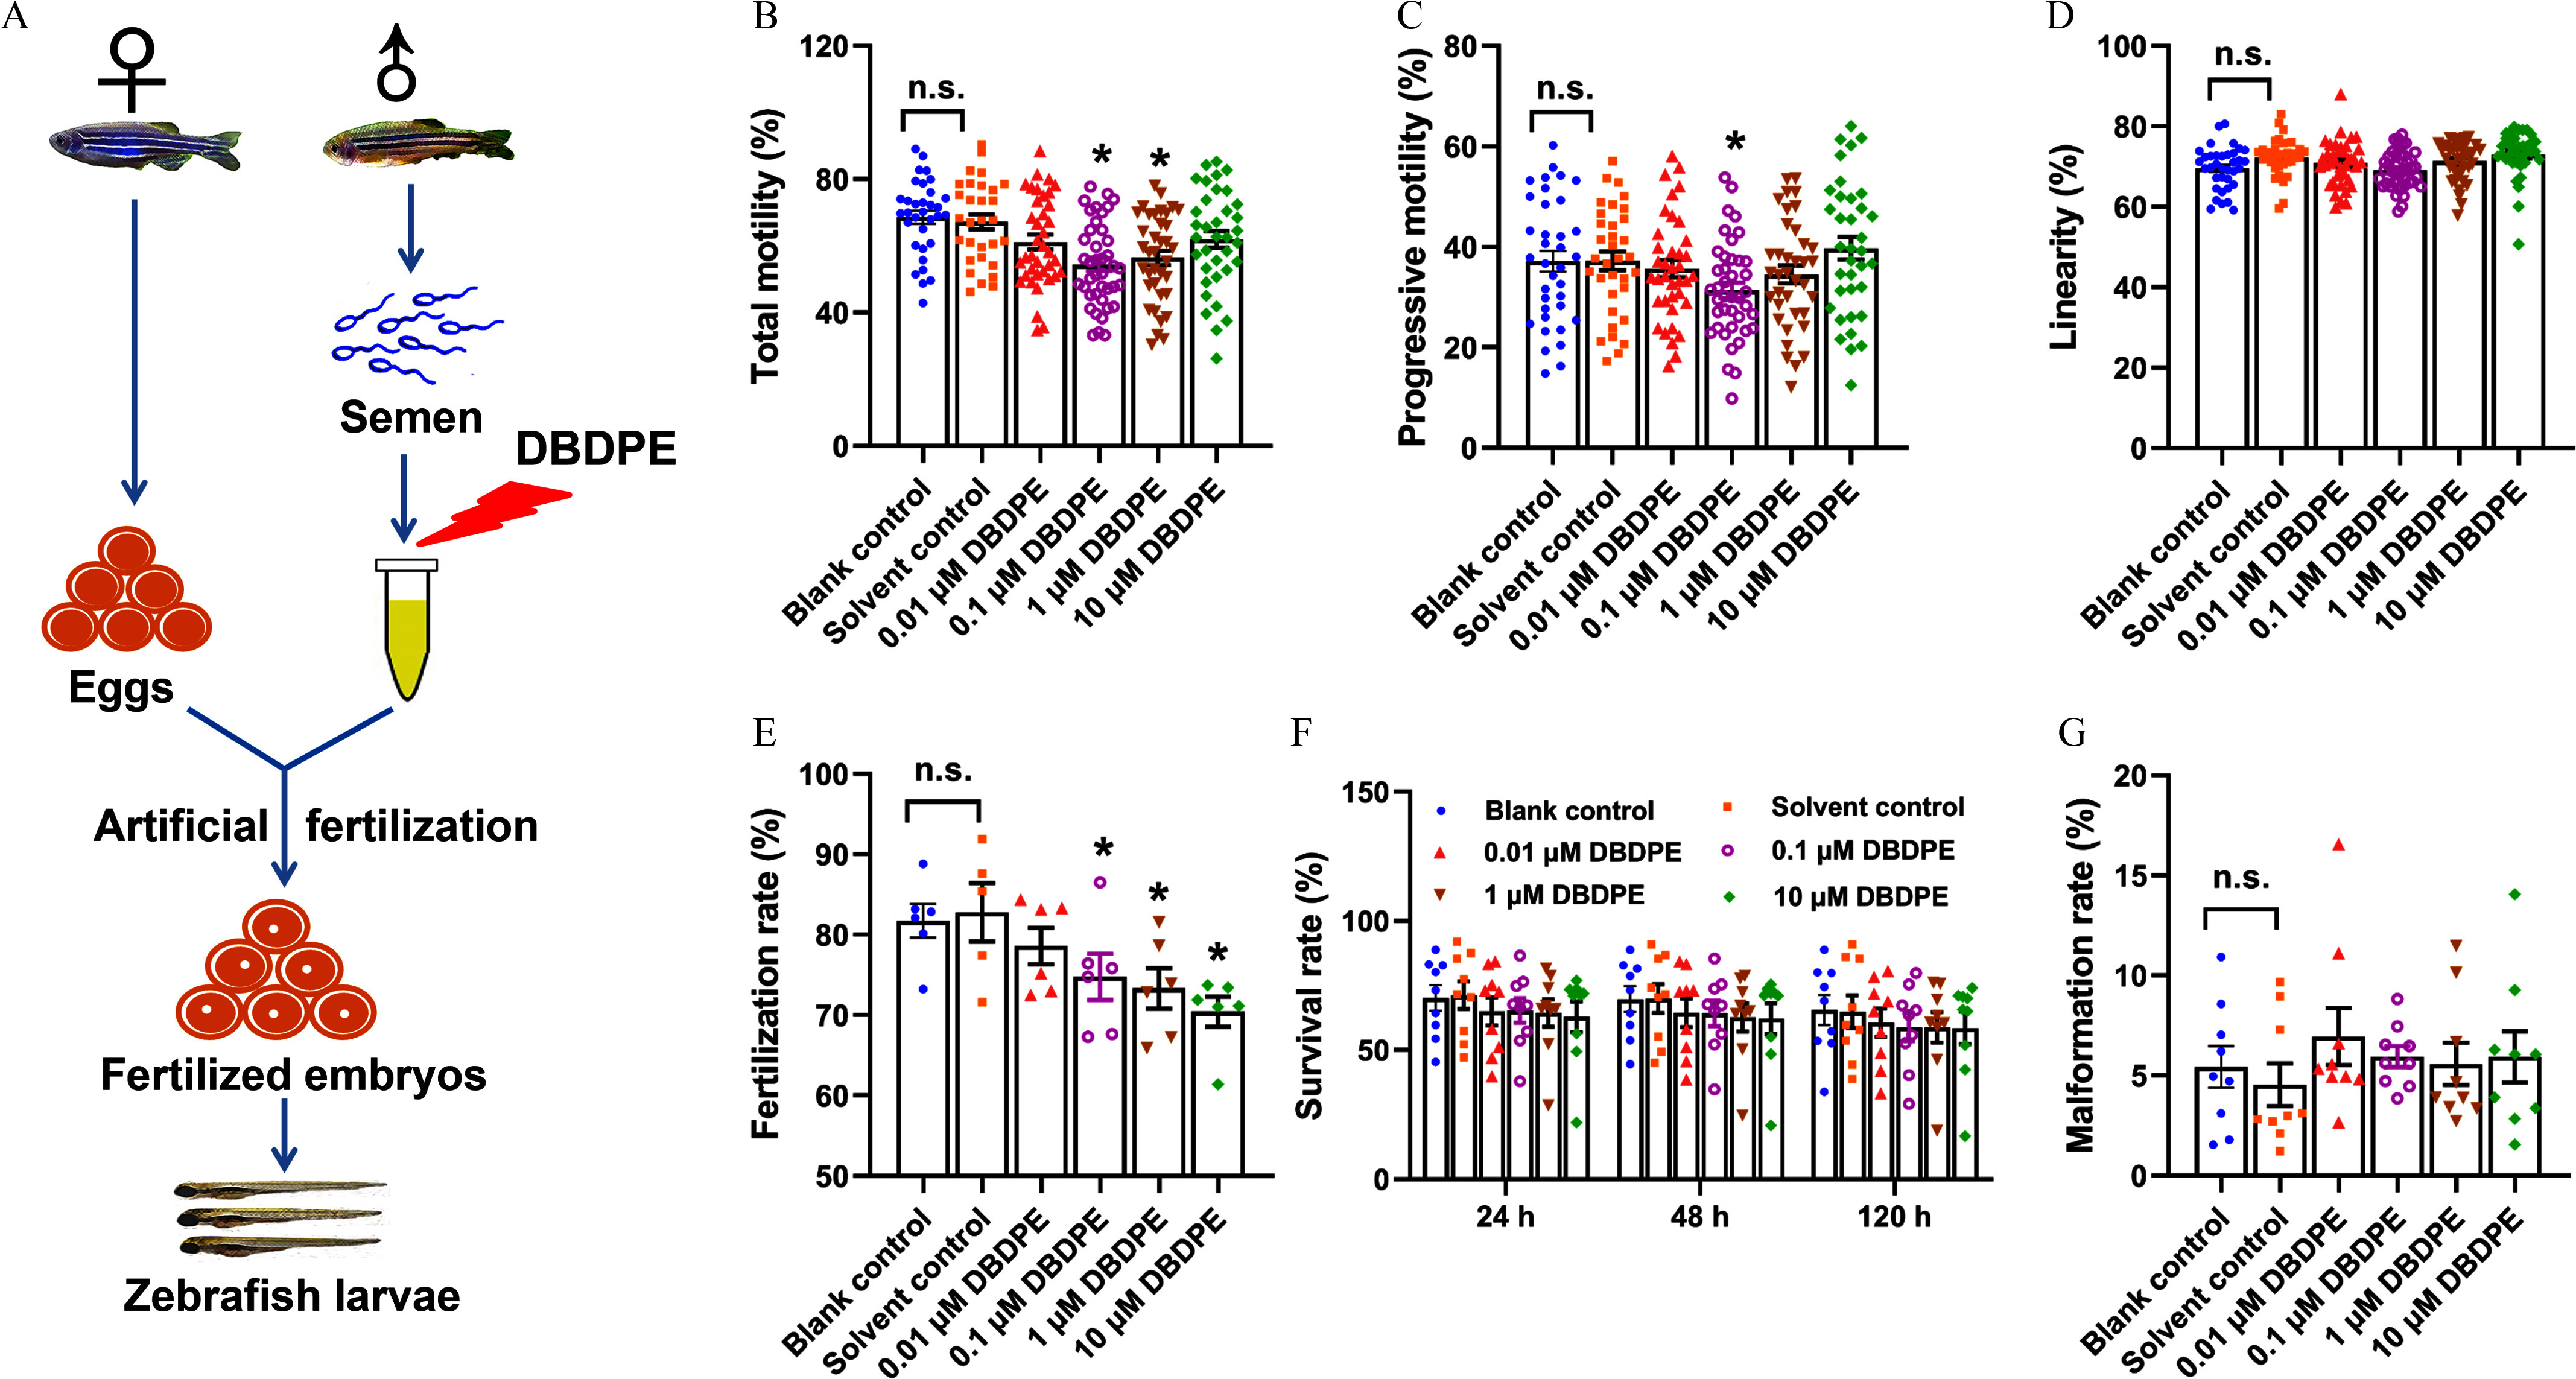
Figure 1.

Effects of DBDPE ex vivo exposure on zebrafish spermatozoa motility and development of offspring obtained by artificial fertilization. (A) Schematic diagram for ex vivo exposure of zebrafish spermatozoa and artificial fertilization. (B) Total motility (TM) of zebrafish spermatozoa. (C) Progressive motility (PM) of zebrafish spermatozoa. (D) Linearity of zebrafish spermatozoa. Each dot in (A–D) represents one replicate data point (mean value of each test sample). The dot numbers represent the data size (/group) for statistical analysis. (E) Fertilization rate of zebrafish embryos derived by artificial fertilization using unexposed eggs and DBDPE-exposed sperm (/group). (F) Survival rate determined at 24 h, 48 h, and 120 h post-hatching (hpf) of zebrafish embryos obtained by artificial fertilization (/group). (G) Malformation rate determined at 120 h post-hatching of zebrafish embryos obtained by artificial fertilization (/group). Results are represented as errors of the mean (SEMs). See Table S1 for definitions of total and progressive motility and linearity of spermatozoa. Data are reported in Excel Table S1. Note: DBDPE, decabromodiphenyl ethane; DMSO, dimethyl sulfoxide. * indicates a significant difference between DBDPE exposure and solvent control groups, by one-way analysis of variance (ANOVA) followed by the post hoc least significant difference (LSD) test; n.s. indicates no significant difference between blank control and solvent control (0.05% DMSO) groups.
