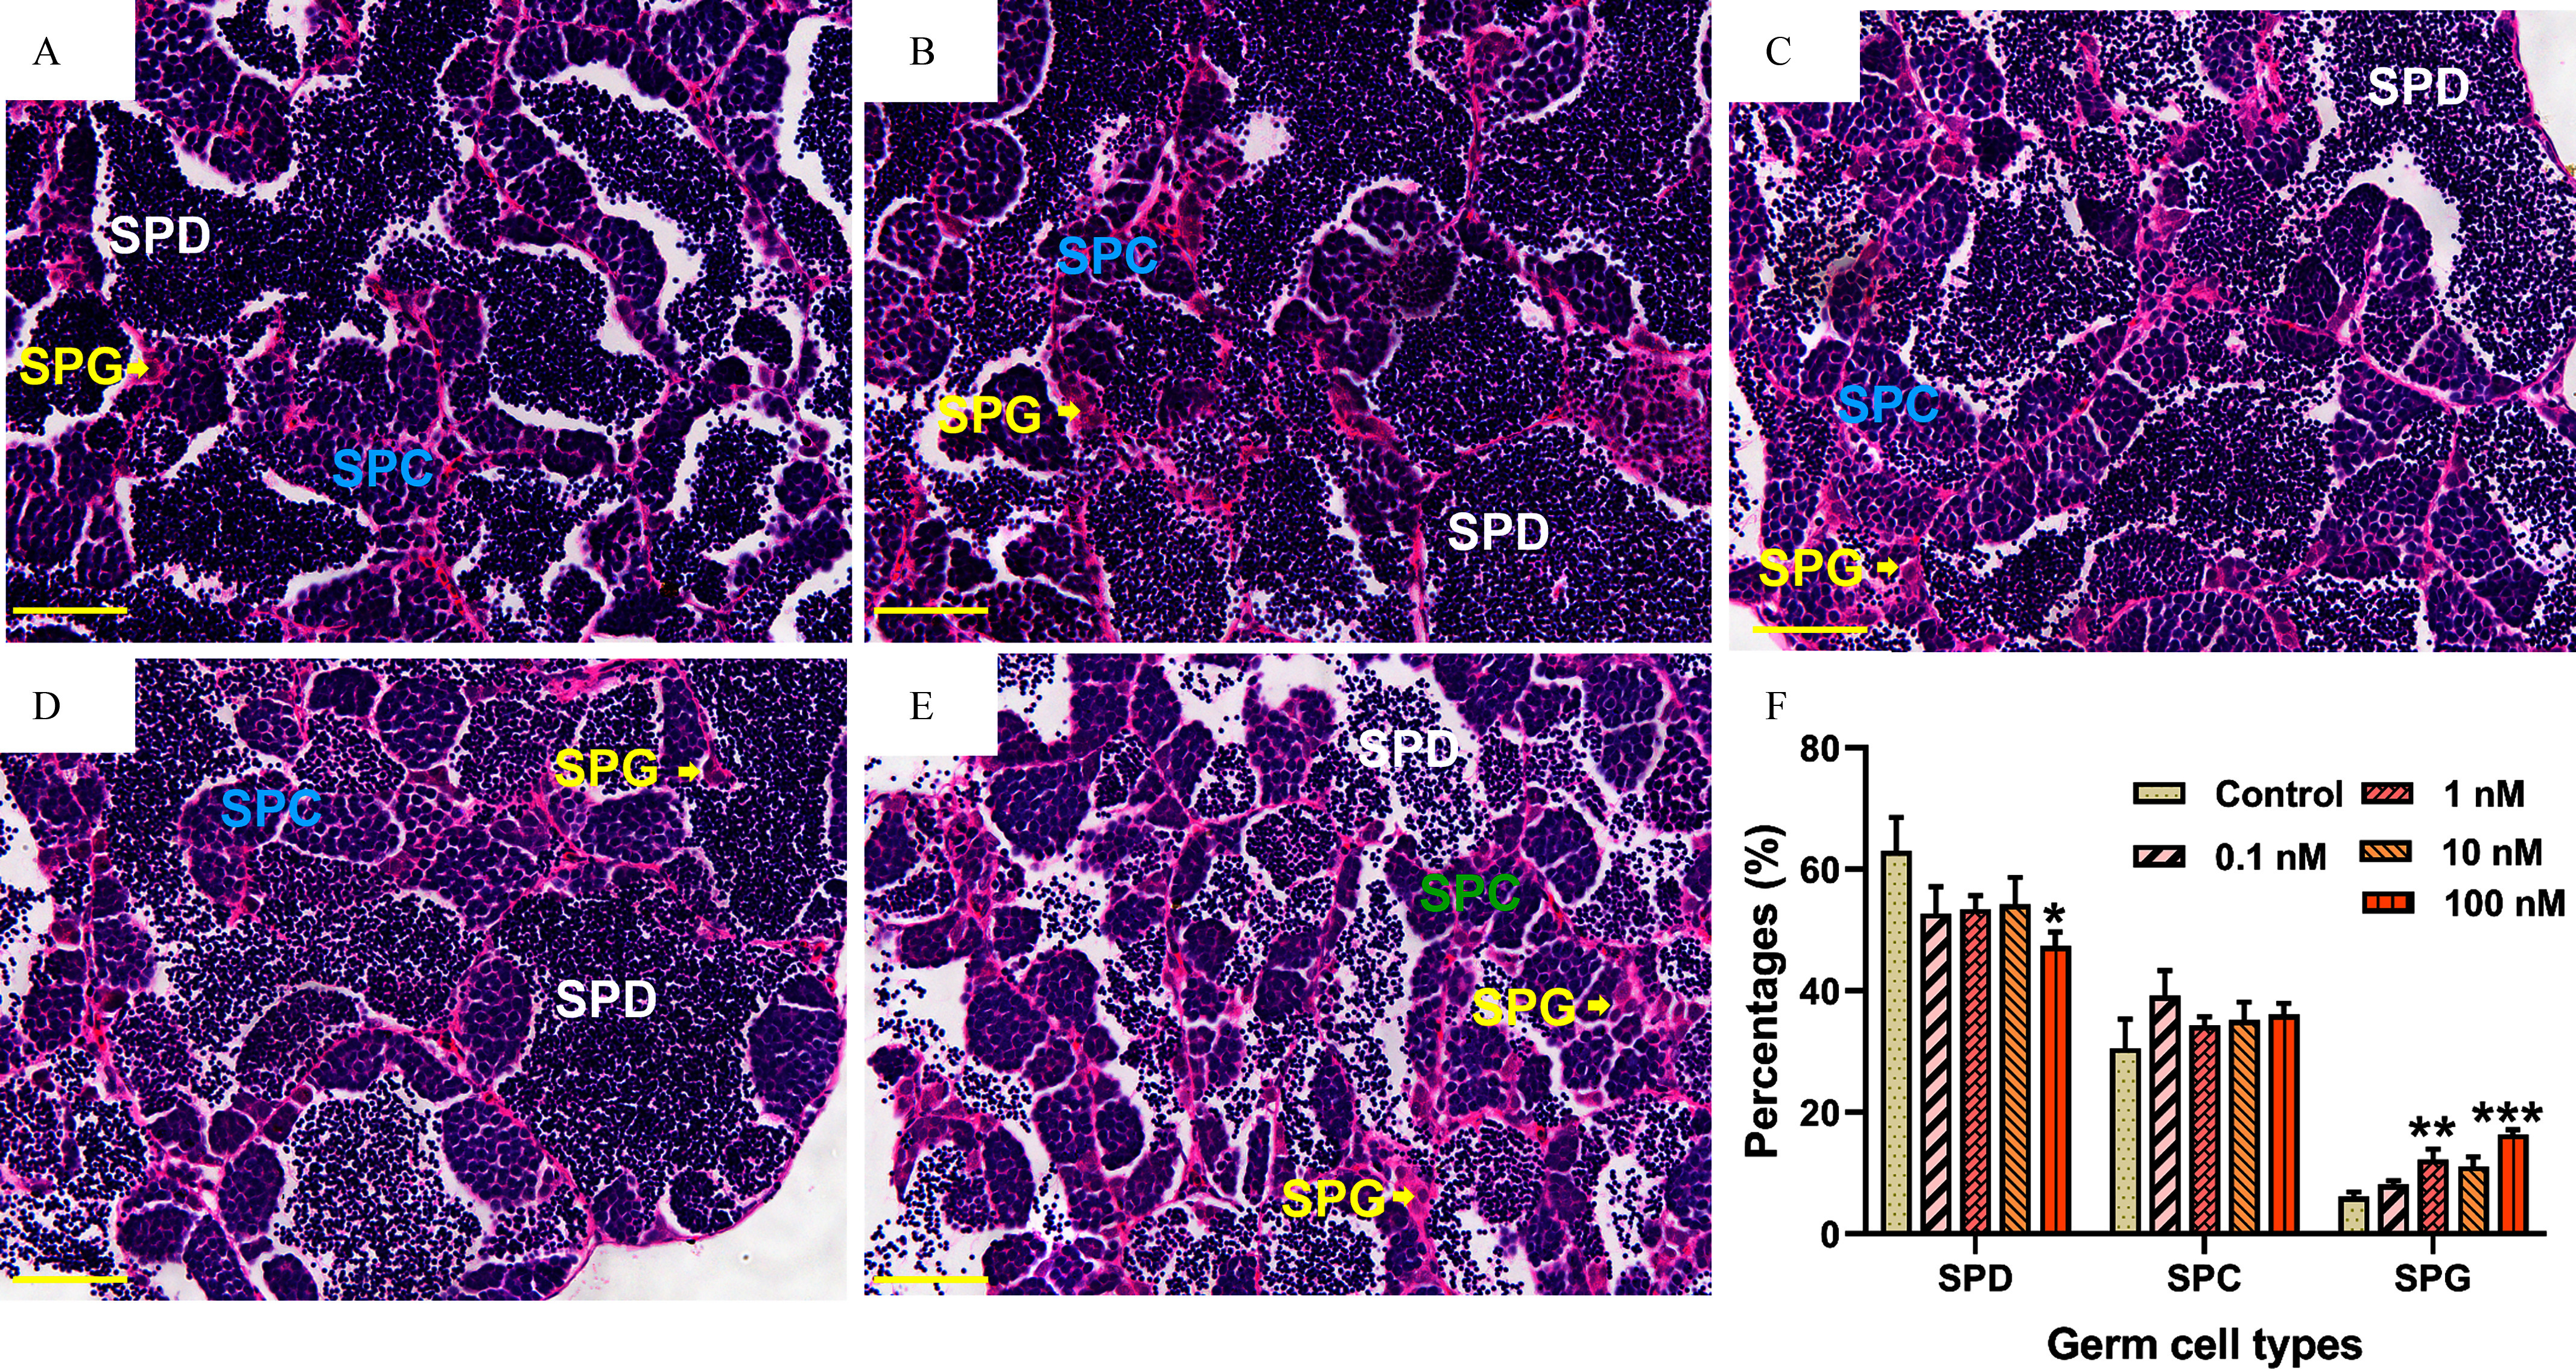
Figure 3.

Histological observations of male zebrafish testes after 2-month in vivo exposure to DBDPE. (A−E) Typical hematoxylin/eosin–stained sections of testes in 0, 0.1, 1, 10, and -exposure groups, respectively. (F) Proportion quantification of germ cells at different developmental stages in testes ( fish/group). Results are represented as errors of the mean (SEMs). Scale bar: . Data are reported in Excel Table S3. Note: DBDPE, decabromodiphenyl ethane; SPC, spermatocytes; SPD, spermatozoa; SPG, spermatogonia. *, **, and *** indicate significant differences between exposure and control groups, by one-way analysis of variance (ANOVA) followed by the post hoc least significant difference (LSD) test.
