. 2024 Nov 21;132(11):117005. doi: 10.1289/EHP14426

Figure 4.

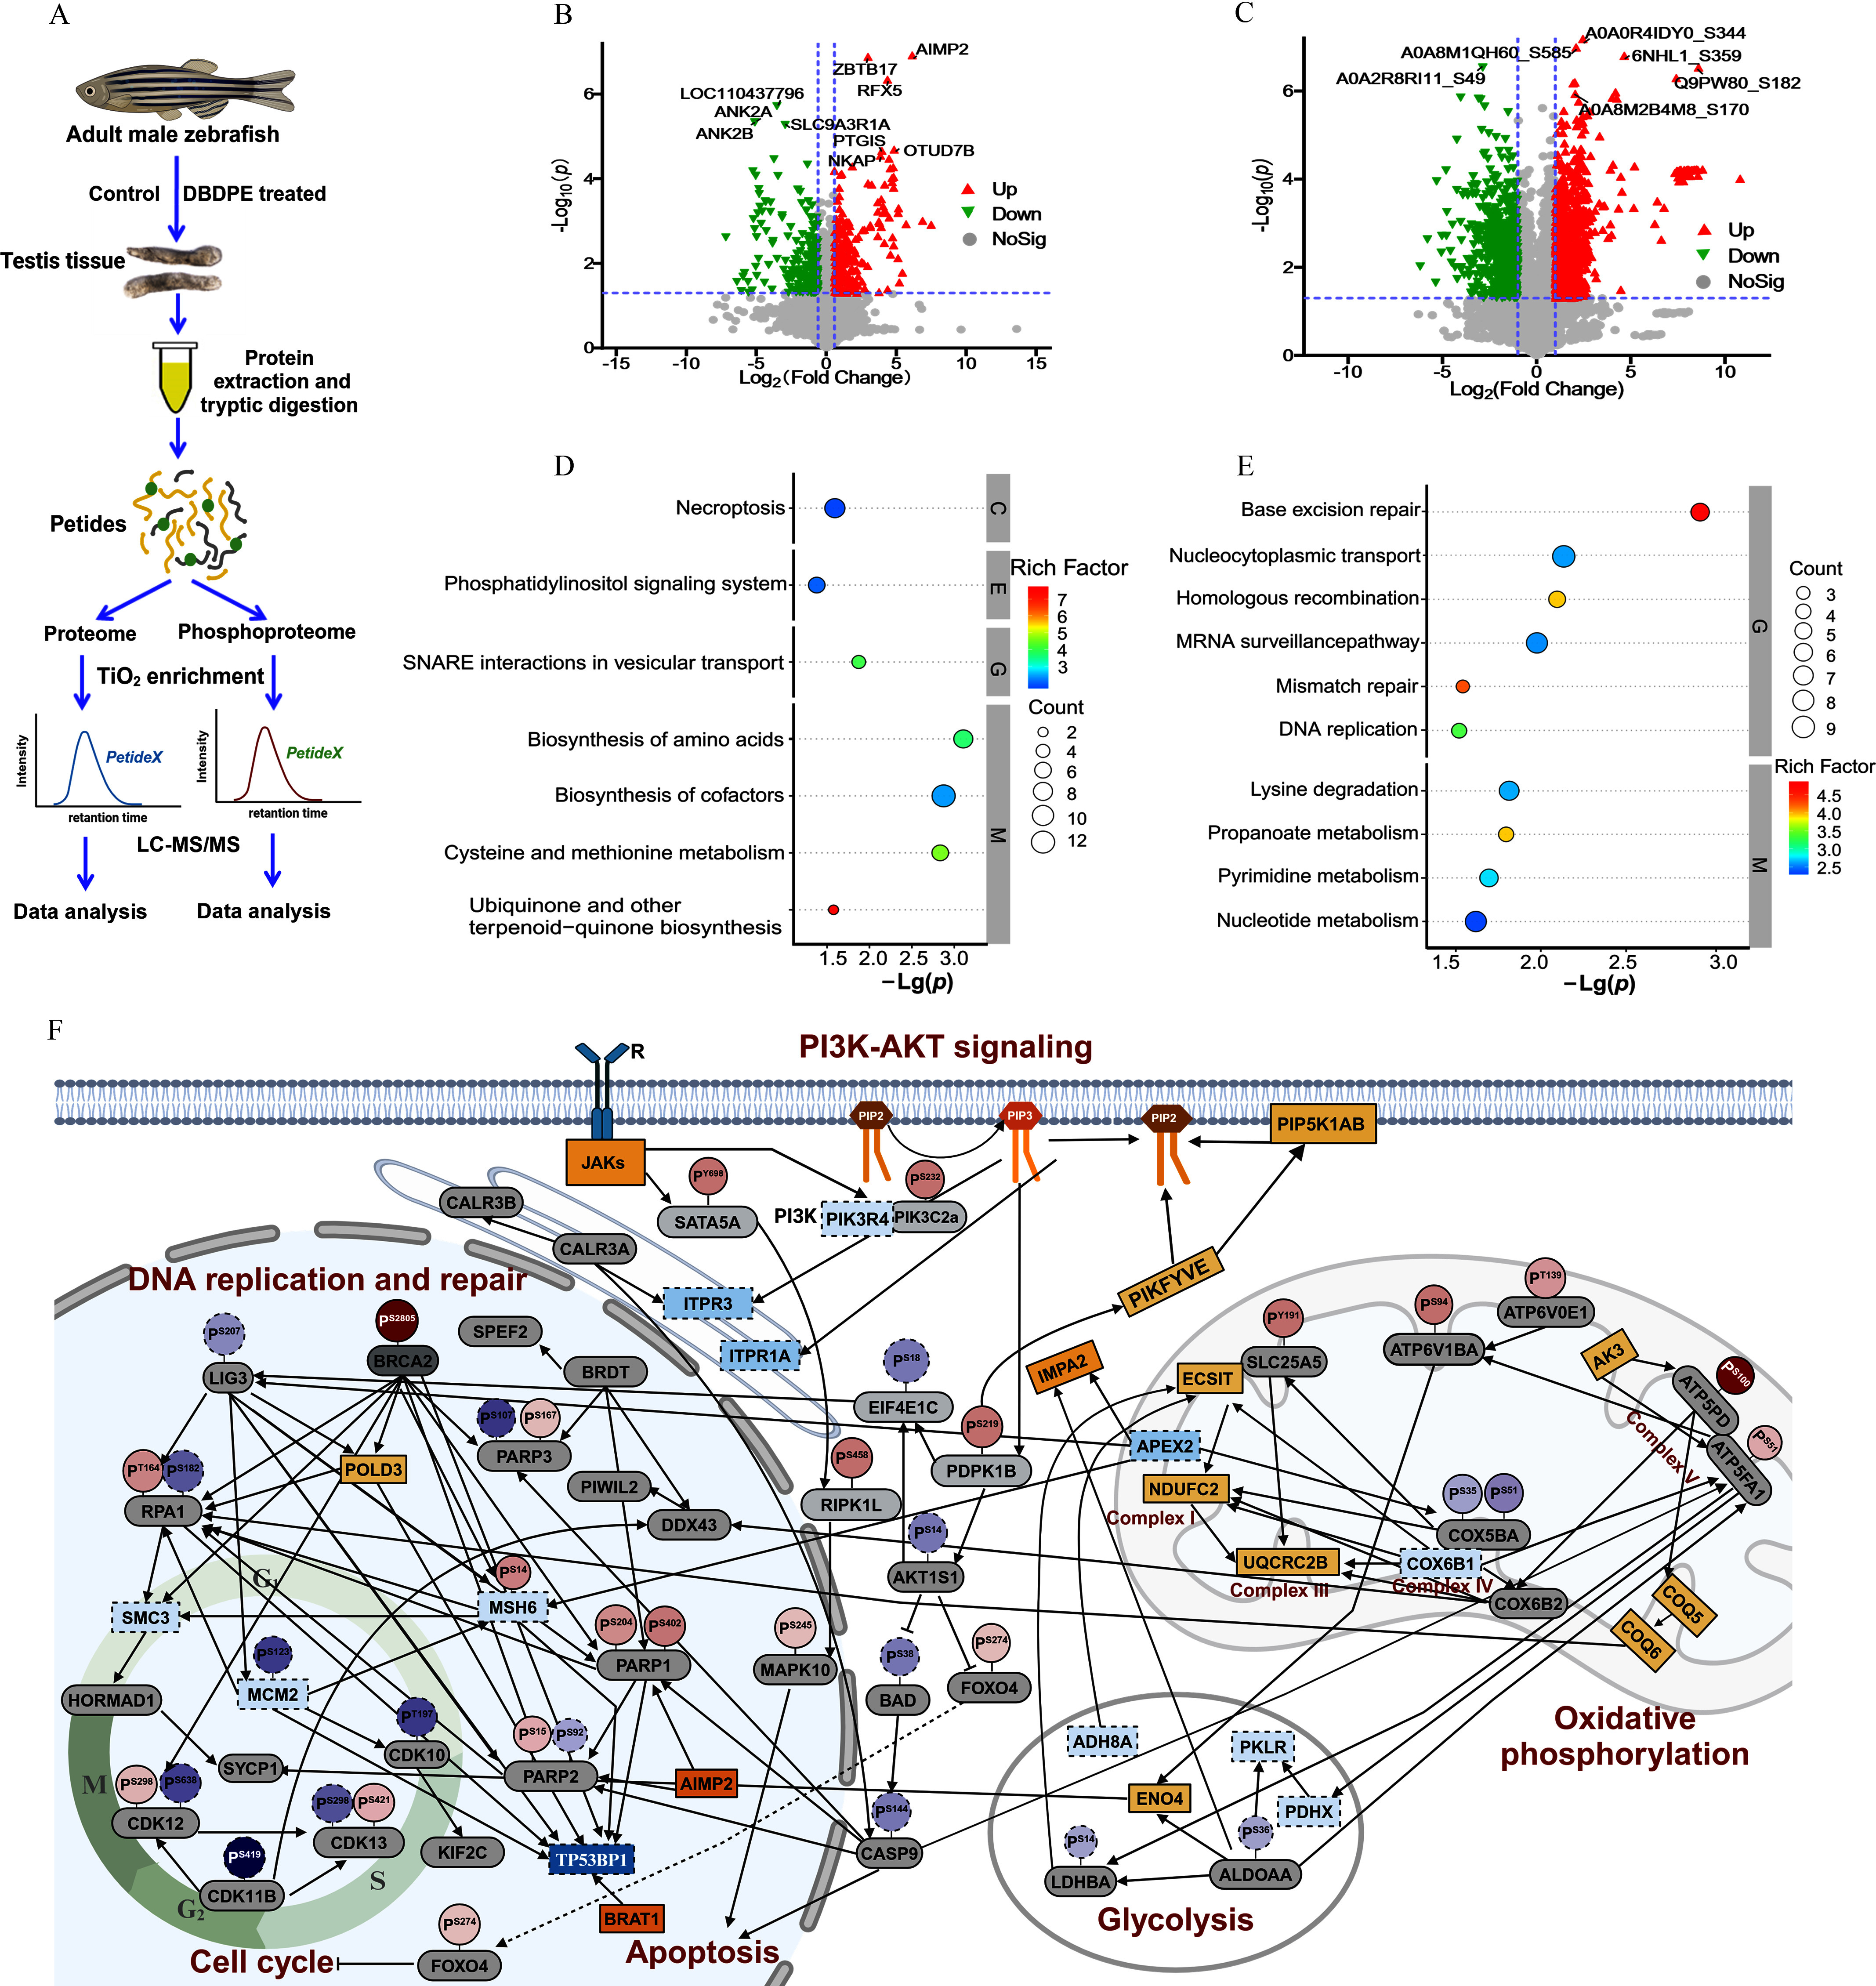
Figure 4A depicts a schematic illustration flowchart with five steps. Step 1: Adult male zebrafish treated with control or decabromodiphenyl ethane produced testis tissue. Step 2: Protein extraction from testicular tissue was followed by tryptic digestion. Step 3: Protein extraction and tryptic digestion resulted in Peptides. Step 4: Peptides resulted in the proteome and phosphoproteome. Step 5: Data analysis was performed on the proteome and phosphoproteome using titanium dioxide enrichment and liquid chromatography-tandem mass spectrometry. Figure 4B and 4C are volcano plots, plotting negative log to the base 10 (lowercase p), ranging from 0 to 6 in increments of 2 (y-axis) across log to the base 2 (fold change), ranging from negative 15 to 15 in increments of 5 and negative 10 to 10 in increments of 5 (x-axis) for up, down, and no significance. Figures 4D and 4E are dot plots, plotting ubiquinone and other terpenoid-quinone biosynthesis, cysteine and methionine metabolism, biosynthesis of cofactors, and biosynthesis of amino acids under M, S N A R E interactions in vesicular transport under G, phosphatidylinositol signaling system under E, and necroptosis under C; and nucleotide metabolism, pyrimidine metabolism, propanoate metabolism, lysine degradation under M, DNA replication, mismatch repair, MRNA surveillance pathway, homologous recombination, nucleocytoplasmic transport, and base excision repair under G (y-axis) across negative log (lowercase italic p), ranging from 1.5 to 3.0 in increments of 0.5 (x-axis). A scale depicts rich factor ranging from 3 to 7 in unit increments and 2.5 to 4.5 in increments of 0.5. A scale depicts count ranging from 2 to 12 in increments of 2, and 3 to 9 in unit increments, respectively. Figure 4F depicts a protein-protein interaction network for the PI3K-AKT signaling pathway, which includes DNA replication and repair, cell cycle, apoptosis, glycolysis, and oxidative phosphorylation.

Whole-proteome and phosphoproteome analysis of male zebrafish testes after in vivo exposure to 100 nM DBDPE. (A) Schematic diagram of proteome and phosphoproteome analysis. The illustration was in part created in BioRender (2024) https://BioRender.com/x32w463. (B) Volcano plot of quantified proteins in 100 nM DBDPE-treated zebrafish testes. (C) Volcano plot of quantified phosphosites in 100 nM DBDPE-treated zebrafish testes. Upward triangle (filled in red; on the upper right corner) and upside-down triangle (filled in green; on the upper left corner) in (B) and (C) indicate up-regulation and down-regulation, respectively; gray dots indicate no significant difference. (D) Significantly enriched KEGG pathways of differentially expressed proteins (DEPs) from whole-proteome data. (E) Significantly enriched KEGG pathways of proteins harboring differentially phosphorylated sites from phosphoproteome data. The size of the dots in (D) and (E) represents the number of DEPs in the pathway, and the color of the dots represents the enrichment factors of KEGG pathway. (F) Protein–protein interaction (PPI) network after exposure to 100 nM DBDPE. The illustration was created in BioRender (2023) https://BioRender.com/o93k219. Each large oval represents protein expression level, and smaller ovals with a tail on top represent phosphorylation levels of specific phosphorylation sites of the protein. Solid line boxes and dotted line boxes respectively indicate up-regulation and down-regulation in the proteome; gray-filled ovals indicate proteins without significant differences. Solid line circles and dotted line circles respectively indicate up-regulation and down-regulation in the phosphoproteome. Color intensity is proportional to log2 (fold change). Data are reported in Excel Table S4. Note: DBDPE, decabromodiphenyl ethane; KEGG, Kyoto Encyclopedia of Genes and Genomes; PI3K-AKT, phosphoinositide 3-kinase/protein kinase B; SNARE, soluble N-ethylmaleimide-sensitive factor attachment protein receptor; TiO2, titanium dioxide.