. 2024 Nov 21;132(11):117005. doi: 10.1289/EHP14426

Figure 8.

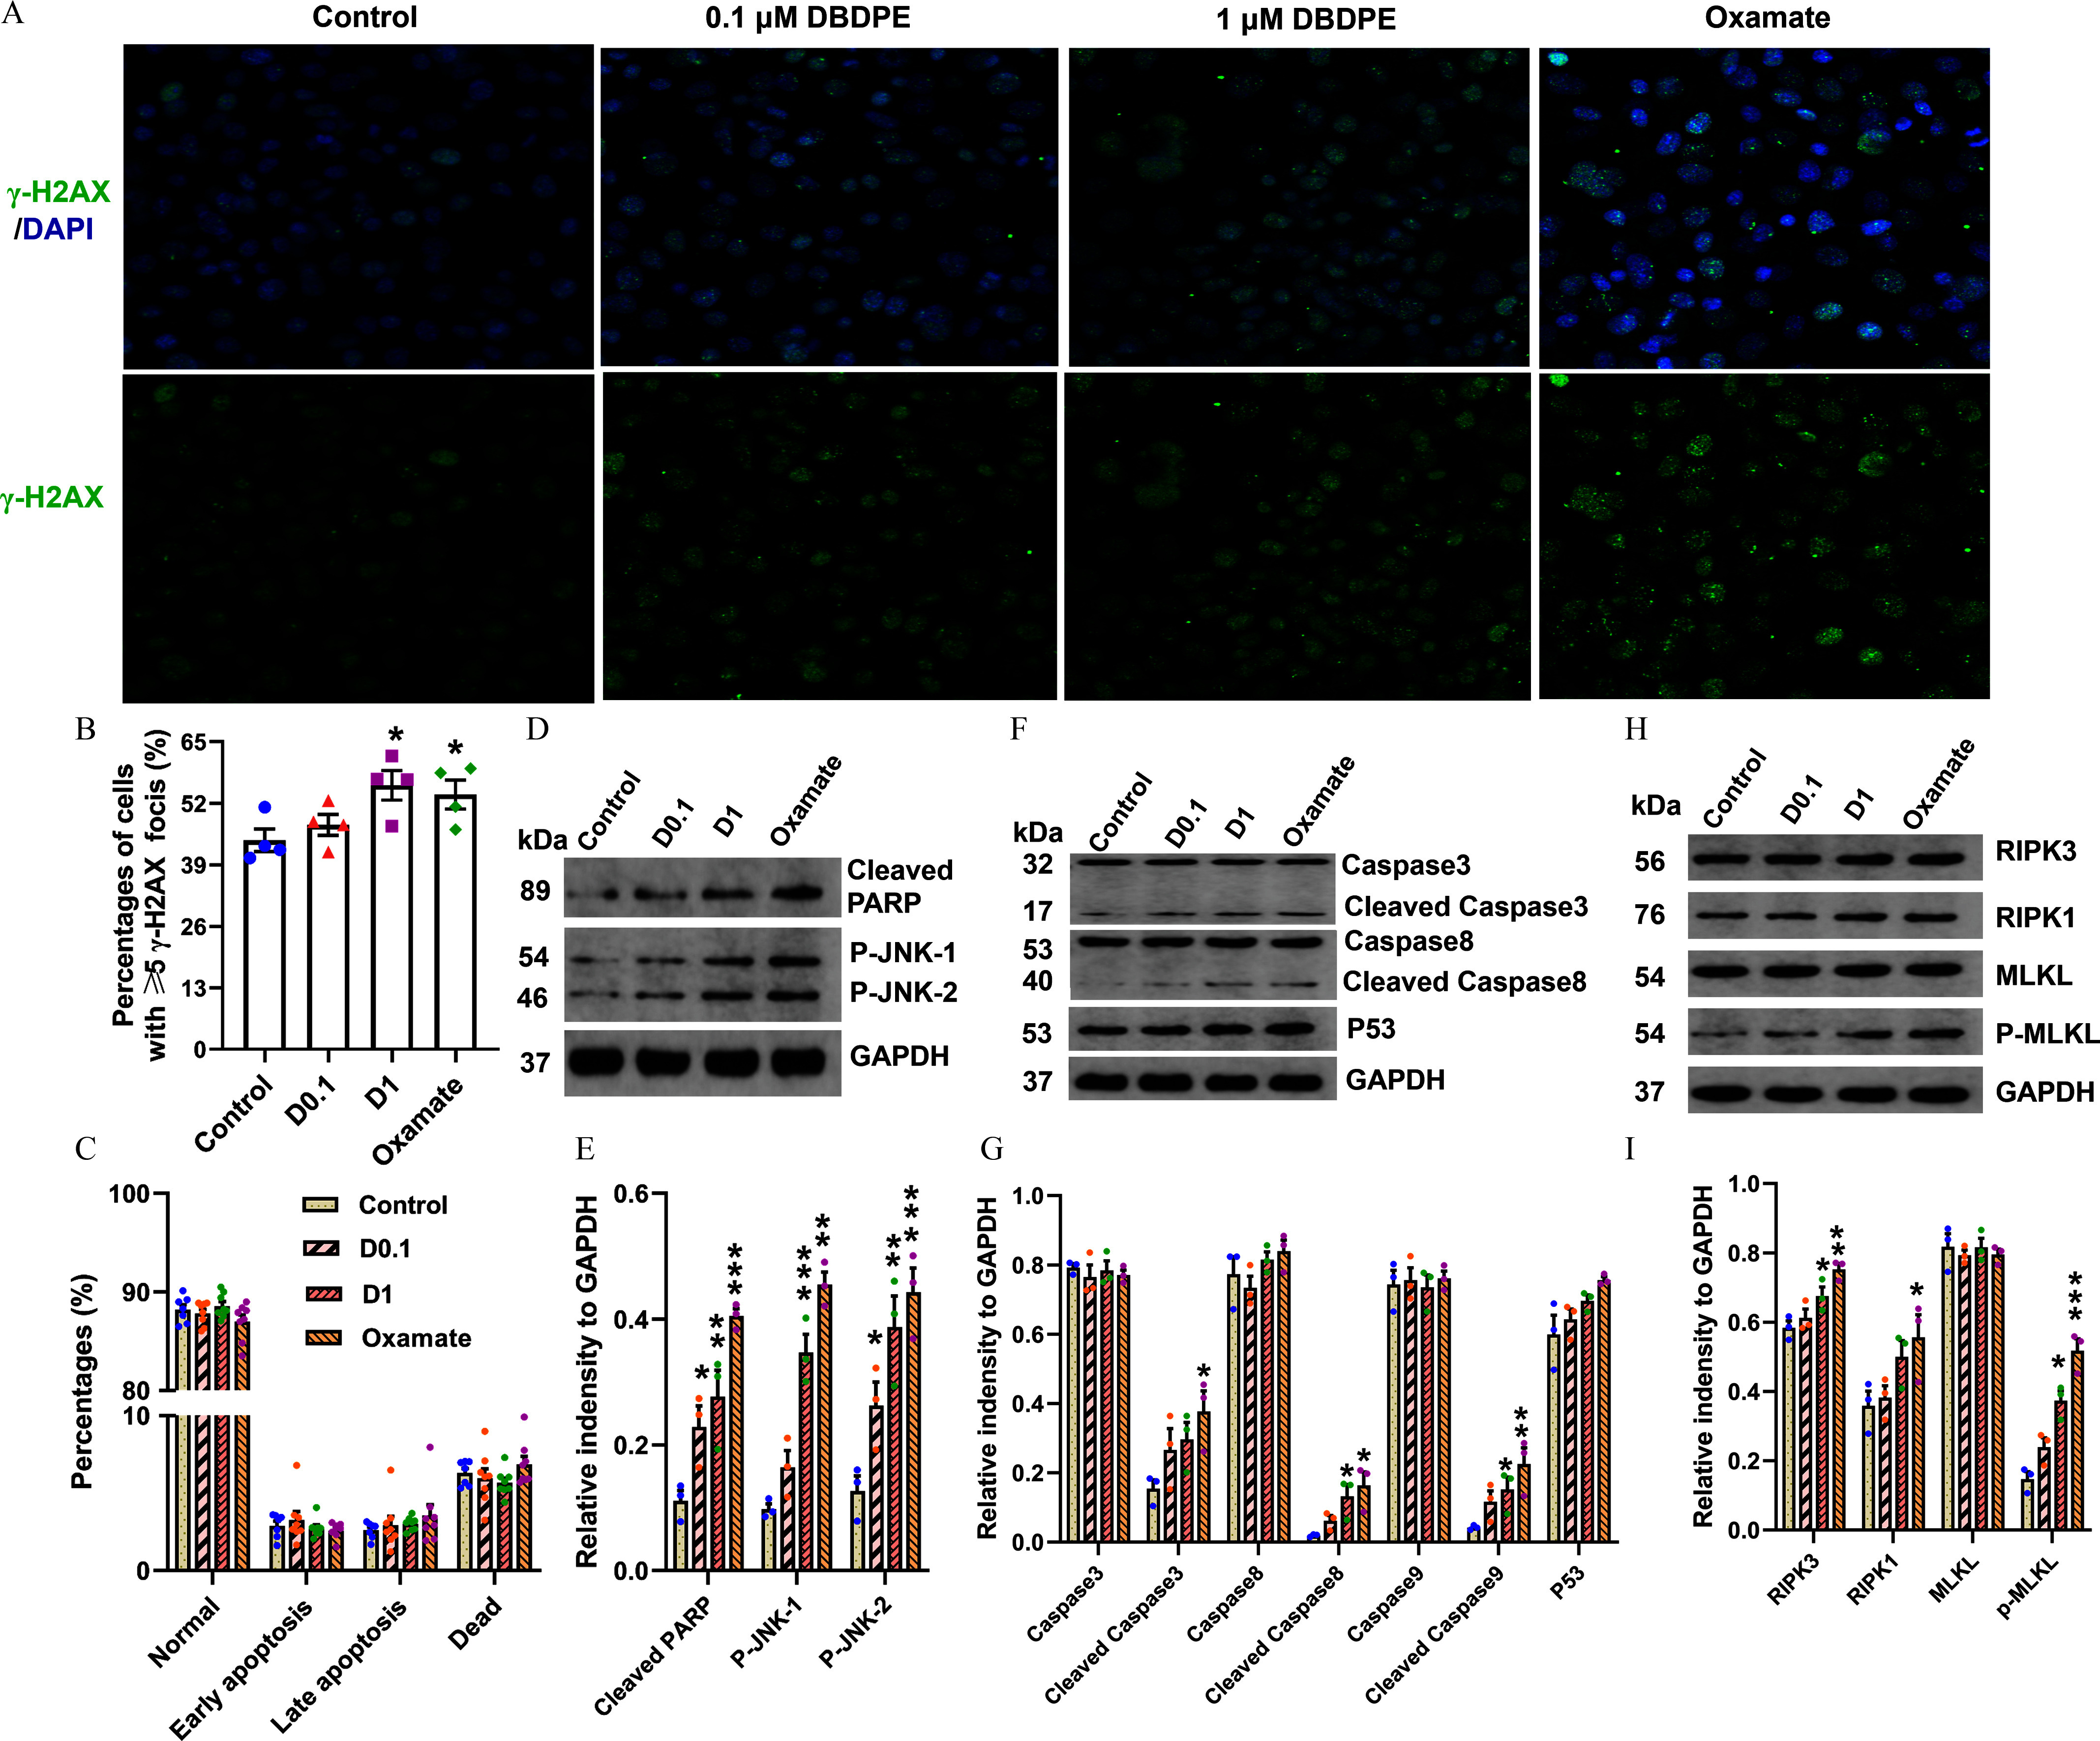
Figure 8A is a stained tissue displaying four columns, namely, control, 0.1 decabromodiphenyl ethane, 1 decabromodiphenyl ethane, and oxamate, and two rows, namely, lowercase gamma-H 2 A X to 4 prime,6-diamidino-2 prime phenylindole, and lowercase gamma-H 2 A X. Figure 8B is a bar graph, plotting percentage of cells with greater than or equal to 5 lowercase gamma H 2 A X foci (percentage), ranging from 0 to 65 in increments of 13 (y-axis) across control, 0.1 decabromodiphenyl ethane, 1 decabromodiphenyl ethane, oxamate (x-axis). Figures 8C, 8E, 8G, 8I are clustered bar graphs, plotting percentage, ranging from 0 to 10 in increments of 10 and 80 to 100 in increments of 10; relative intensity to glyceraldehyde-3-phosphate dehydrogenase, ranging from 0.0 to 0.6 in increments of 0.2; relative intensity to glyceraldehyde-3-phosphate dehydrogenase, ranging from 0.0 to 1.0 in increments of 0.2; and relative intensity to glyceraldehyde-3-phosphate dehydrogenase, ranging from 0.0 to 1.0 in increments of 0.2 (y-axis) across normal, early apoptosis, late apoptosis, dead; cleaved P A R P, P-J N K-1, P-J N K-2; caspase 3, cleaved caspase 3, caspase 8, cleaved caspase 8, caspase 9, cleaved caspase 9, P 53; and R I P K 3, R I P K 1, M L K L, and p-M L K L (x-axis) for control, 0.1 decabromodiphenyl ethane, 1 decabromodiphenyl ethane, oxamate. Figure 8D is a Western blot with four columns, namely, control, 0.1 decabromodiphenyl ethane, 1 decabromodiphenyl ethane, and oxamate, and four rows, namely, 89 kilodalton under cleaved P A R P, 54 kilodalton under P-J N K-1, 46 kilodalton under P-J N K-2, and 37 kilodalton under glyceraldehyde-3-phosphate dehydrogenase. Figure 8F is a Western blot with four columns, namely, control, 0.1 decabromodiphenyl ethane, 1 decabromodiphenyl ethane, and oxamate, and six rows, namely, 32 kilodalton under caspase 3, 17 kilodalton under cleaved caspase 3; 53 kilodalton under caspase 8; 40 kilodalton under cleaved caspase 8; 53 kilodalton under P 53, and 37 kilodalton under glyceraldehyde-3-phosphate dehydrogenase. Figure 8H is a Western blot with four columns, namely, control, 0.1 decabromodiphenyl ethane, 1 decabromodiphenyl ethane, and oxamate, and five rows, namely, 56 kilodalton under R I P K 3, 76 kilodalton under R I P K 1, 54 kilodalton under M L K L, 54 kilodalton under P-M L K L, and 37 kilodalton under glyceraldehyde-3-phosphate dehydrogenase.

DNA damage and expression of proteins related to apoptosis or necroptosis in mouse spermatogonial GC-1 cells exposed to DBDPE and oxamate (LDH inhibitor) in vitro. (A) DNA damage in zebrafish testes detection by immunofluorescence staining against the histone protein γ-H2AX. The representative images show DAPI-stained (blue) nuclei with nuclear γ-H2AX foci in green. (B) Percentages of GC-1 cells with 5 γ-H2AX foci (n=4). (C) Cell apoptosis detection by flow cytometry (FCM) using an Annexin V-FITC Apoptosis Detection Kit (n=78). (D) Western blotting analyses carried out with antibodies against caspase-3, cleaved caspase-3, caspase-8, cleaved caspase-8, P53, and GAPDH in GC-1 cells. (E) Western blotting analyses carried out with antibodies against cleaved PARP, p-JNK, and GAPDH in GC-1 cells. (F) Western blotting analyses carried out with antibodies against RIPK3, RIPK1, MLKL, p-MLKL, and GAPDH in GC-1 cells. (H–I) Quantification of the abundances of proteins relative to GAPDH (n=3). Each dot in (E–I) represents one replicate data point (one well of cells/replicate). The dot numbers represent the data size for statistical analysis. Results are represented as means±standard errors of the mean (SEMs). Data are reported in Excel Table S8. Note: DBDPE, decabromodiphenyl ethane; FITC, fluorescein isothiocyanate; glyceraldehyde-3-phosphate dehydrogenase; LDH, lactate dehydrogenase; MLKL, mixed lineage kinase domain-like; PARP, poly(adenosine diphosphosphate-ribose) polymerase; p-JNK, phospho-c-jun N-terminal kinase; RIPK, receptor-interacting serine-threonine kinase 3. *p<0.05, **p<0.01, and ***p<0.001 indicate significant differences between exposure and control groups, by one-way analysis of variance (ANOVA) followed by the post hoc least significant difference (LSD) test.