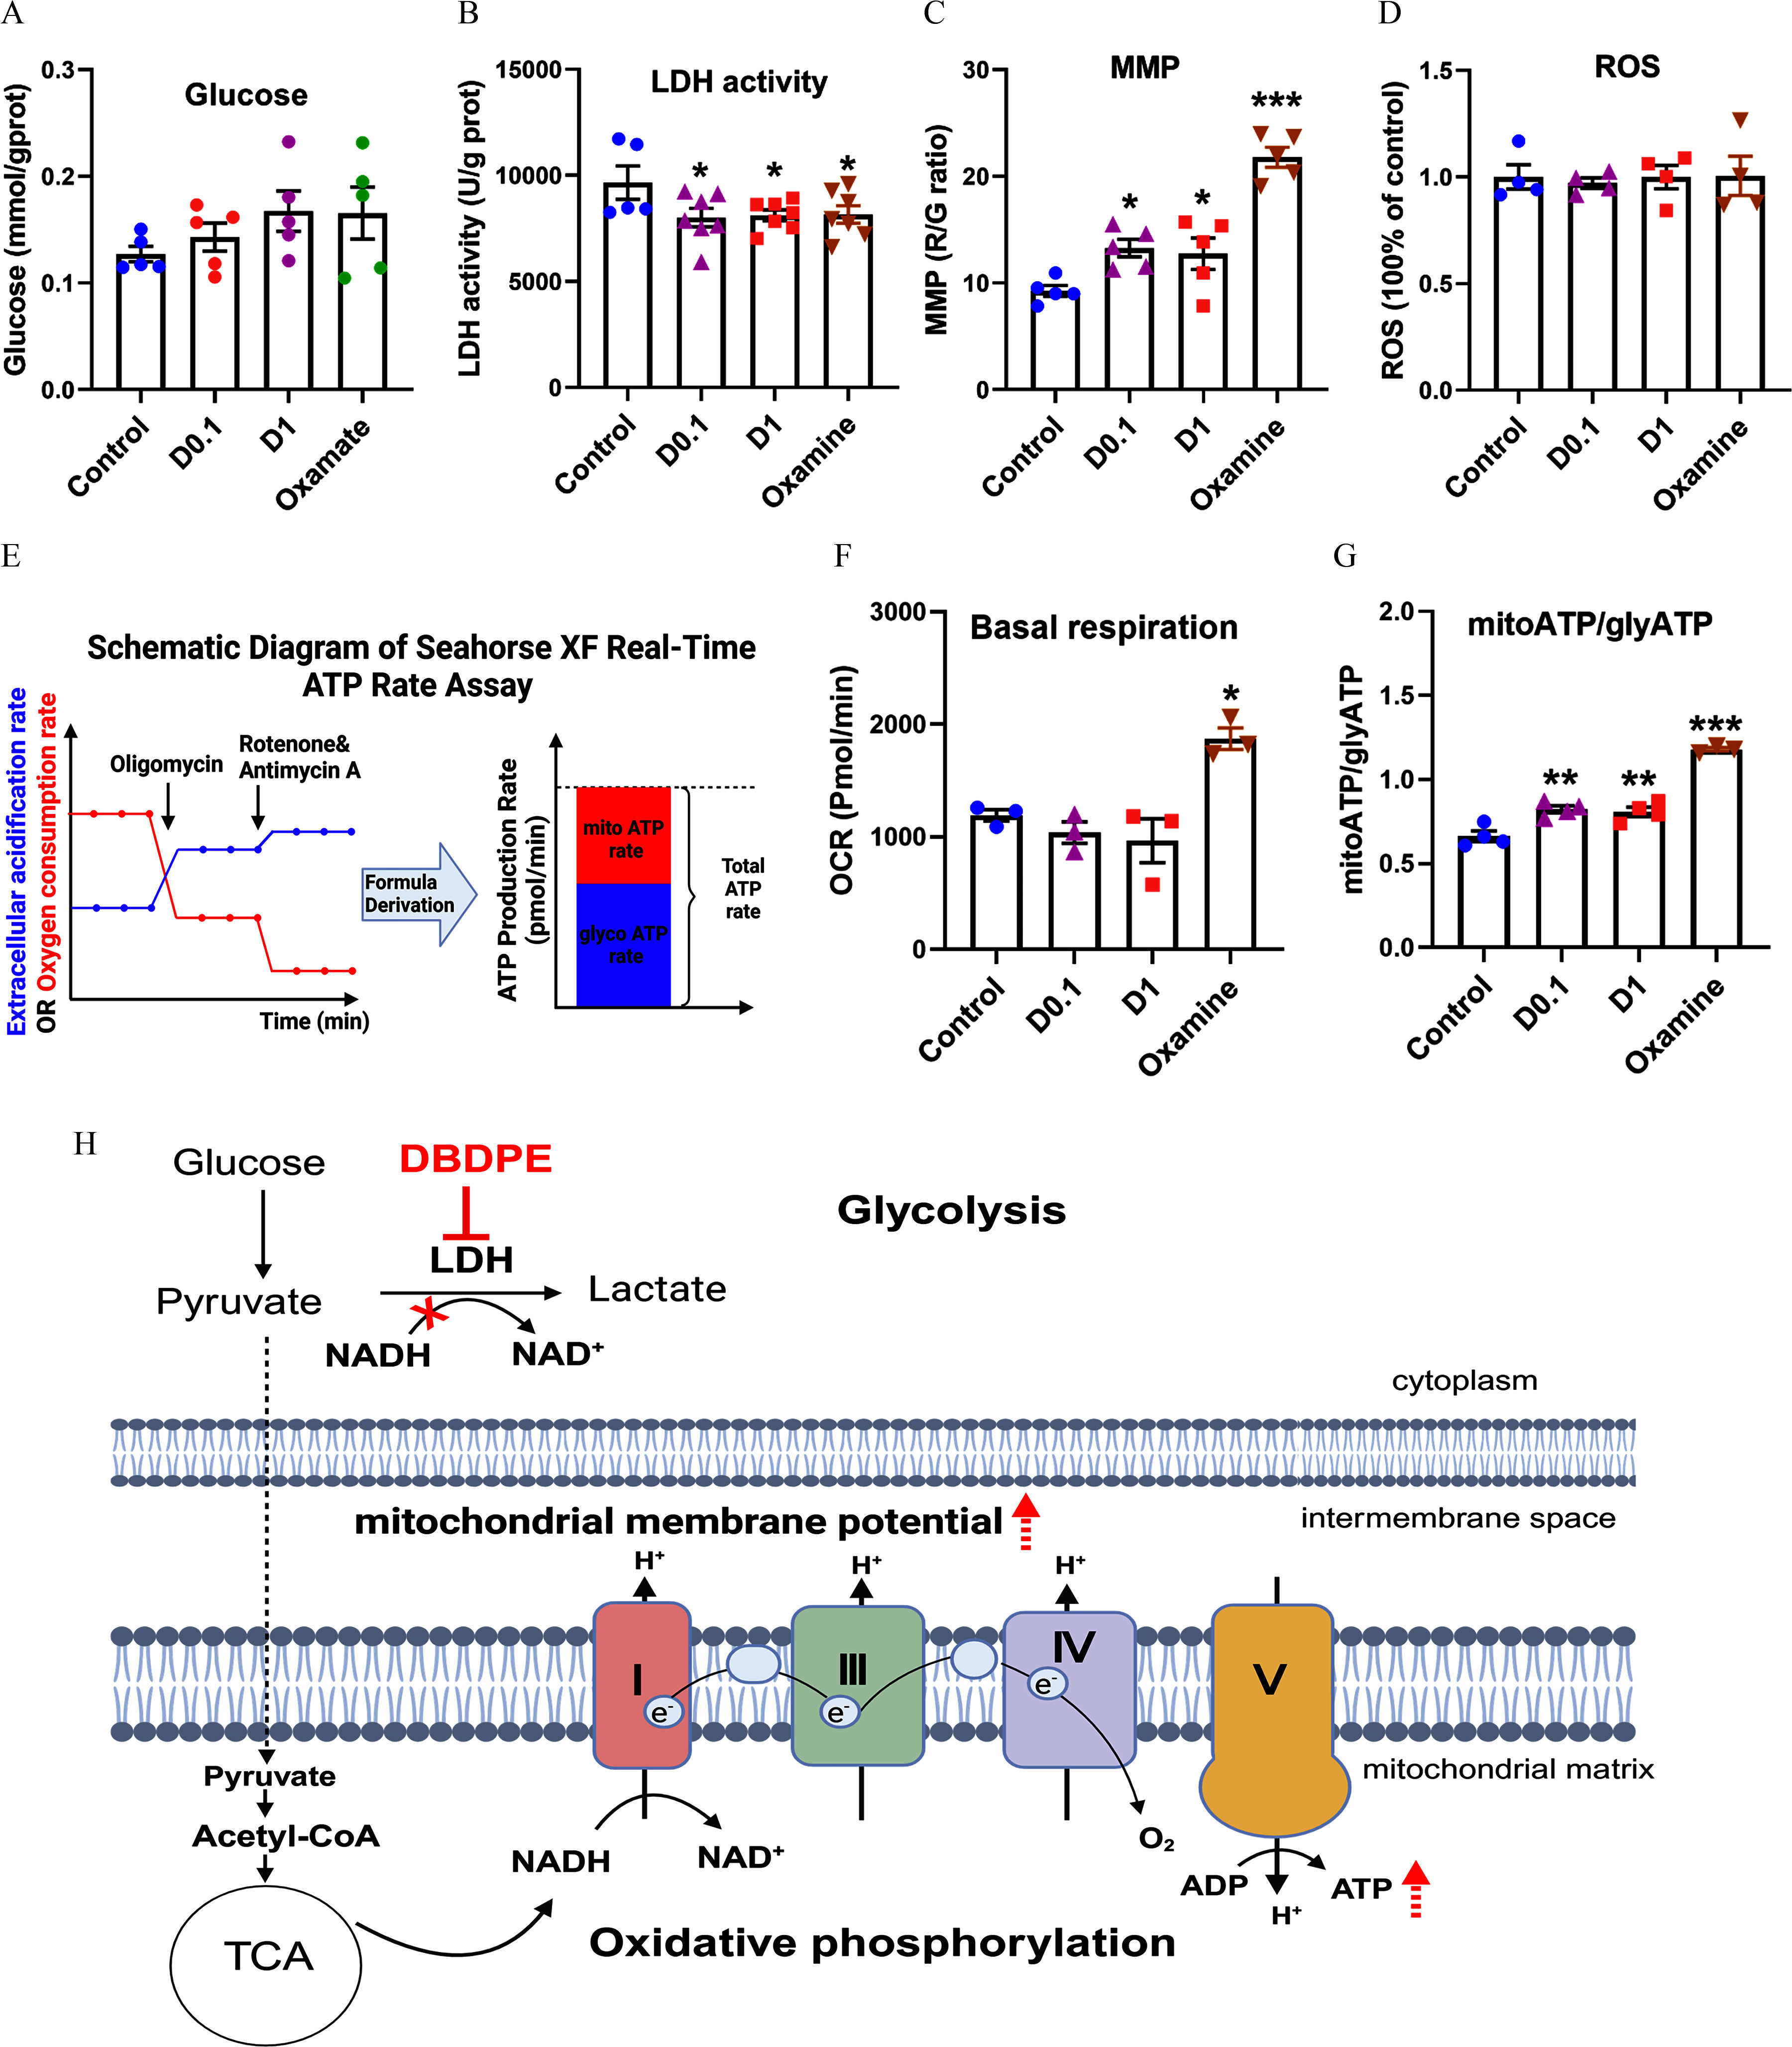
Figure 9.

Energy metabolic levels in mouse spermatogonial GC-1 cells exposed to DBDPE and oxamate (LDH inhibitor) in vitro. (A) Glucose content in GC-1 cells treated for 72 h (). (B) LDH activity in GC-1 cells treated for 72 h (). (C) Mitochondrial membrane potential (MMP) of GC-1 cells treated for 72 h (). (D) ROS levels in GC-1 cells treated for 72 h (). (E) Schematic diagram of the Seahorse XF real-time ATP rate assay. The relative contributions of mitochondrial oxidative phosphorylation and glycolysis to ATP can be determined. The illustration was created in BioRender (2023) https://BioRender.com/p67n031. (F) Quantification of basal respiration in response to DBDPE or oxamate (LDH inhibitor) after 72 h of treatment (). (G) Glycolysis-derived ATP (glycoATP)/mitochondrial oxidative phosphorylation-derived ATP (mitoATP) ratio in GC-1 cells exposed to DBDPE ( and ) and oxamate (LDH inhibitor) for 72 h (). Each dot in (A–D,F,G) represents one replicate data point (one well of cells/replicate). (H) Proposed action of DBDPE on glycolysis and oxidative phosphorylation based on findings of the in vitro and in vivo studies. The illustration was created in BioRender (2023) https://BioRender.com/g29w956. Upward dashed arrows (in red) indicate elevation. The red cross indicates inhibition. Results are represented as errors of the mean (SEMs). Data are reported in Excel Table S9. Note: ATP, adenosine triphosphate; D, DBDPE, decabromodiphenyl ethane; G, green; LDH, lactate dehydrogenase; , nicotinamide adenine dinucleotide; NADH, nicotinamide adenine dinucleotide reduced; R, red; ROS, reactive oxygen species; TCA, tricarboxylic acid (cycle). *, **, and *** indicate significant differences between exposure and control groups, by one-way analysis of variance (ANOVA) followed by the post hoc least significant difference (LSD) test.
