Figure 2.
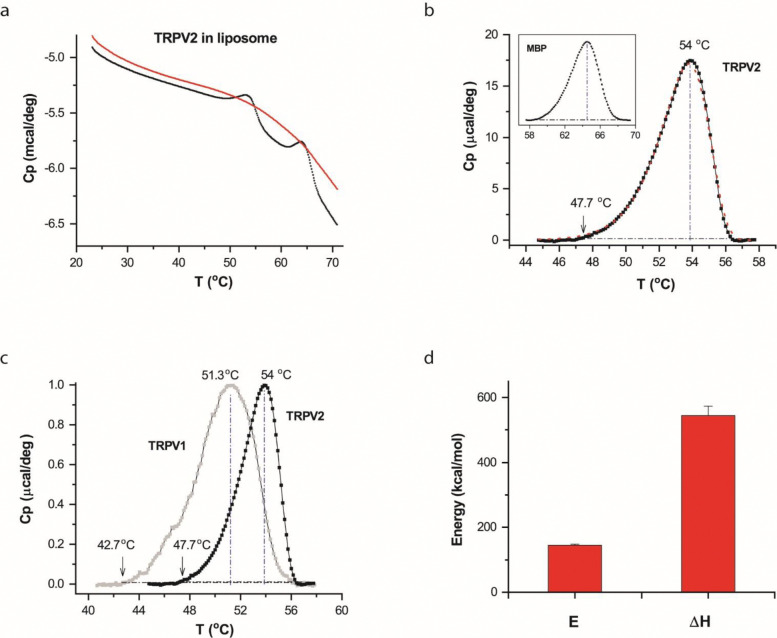
DSC transitions of TRPV2 in vesicles. A) Representative DSC scans of TRPV2 proteins reconstituted in liposomes. The trace in red corresponds to repeated scan, showing the irreversibility of the DSC transition of TRPV2. B) Thermograph of excess heat capacity of TRPV2 proteins (dotted black curve). The red curve represents the fit by a two-state model. The vertical line and the arrow indicated temperatures where the transition reached the peak or 1% of the peak amplitude. The inset shows the profile of the excess heat capacity of MBP fused to the channel protein. C) Comparison of DSC transitions of TRPV2 (solid black) and TRPV1 (grey), showing that the transitions of TRPV2 occurred at higher temperatures as expected from its higher heat activation temperature. The temperature thresholds of the DSC transitions were also in the range of the temperature threshold of the heat activation of TRPV2. D) Average plot of DSC enthalpy change (ΔH) and activation energy (E) of TRPV2 in liposomes (n=9). DSC scanning rate was 1.0 °C/min.

