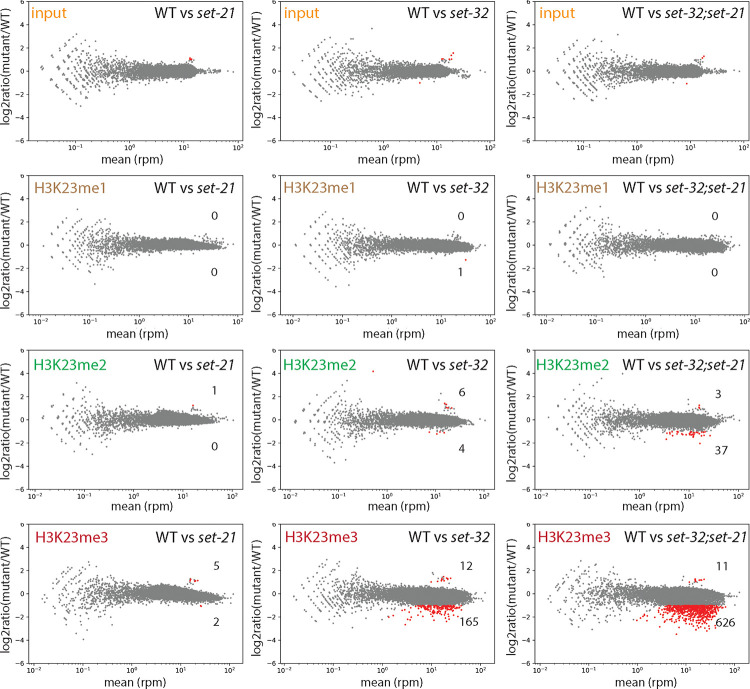
Figure 3. MA-plots of H3K23me1, me2, and me3 ChIP-seq comparing WT versus set-21(red109), set-32(red11), or set-32(red11);set-21(red109) mutant.
Average RPM (reads per million sequenced tags) values from two replicates were calculated for each 1kb window throughout the whole genome. Regions with increased or decreased H3K23me in a mutant (highlighted in red) were determined by the BaySeq program 74 with a minimal 2-fold difference (FDR≤0.05), subtracting the regions that showed differential input signals (the top row). The numbers of regions with either increased or decreased H3K23me in a mutant were indicated in each panel.

