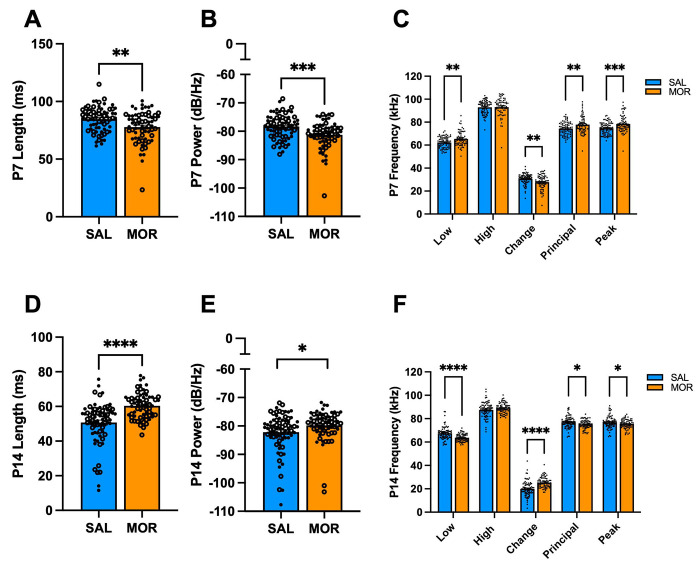
Figure 5. Acoustic features of USVs emitted during spontaneous morphine withdrawal in FVB/N pups on P7 and P14.
Data are plotted as the mean ± SEM. For A,B, D, and E: closed circles = females; open circles = males. For C and F, closed circles include both sexes to avoid clutter. Data were analyzed using linear mixed models with Saline Treatment, Female Sex, and NCrl Substrain as the reference variables. The following data are collapsed across Substrain for simplicity. A. P7 Length: There were no interactions (all p ≥ 0.63). Morphine Treatment was associated with shorter USV duration (β = −0.0063, SE = 0.0021, t(144) = −3.054, **p = 0.0027). B. P7 Power: Morphine Treatment was associated with reduced USV power (β = −2.69, SE = 0.76, t(144) = −3.54, ***p = 0.00055). C. P7 Frequencies: Morphine Treatment was associated with higher lowest frequency (β = 3.056, SE = 0.92, t(144) = 3.31, **p = 0.0012), reduced change in frequency (β = −2.94, SE = 0.88, t(144) = −3.34, **p = 0.0011), increased principal frequency (β = 3.36, SE = 1.08, t(144) = 3.12, **p = 0.0022), and increased peak frequency (β = 3.71, SE = 1.03, t(144) = 3.61, ***p = 0.00042). There was no effect of Morphine Treatment on high frequency (β = 0.12, SE = 1.13, t(44) = 0.11, p = 0.92). SAL, n = 73 (41F, 32M); MOR, n = 66 (37F, 29M). D. P14 Length: There were no interactions (all p ≥ 0.091). Morphine Treatment was associated with increased USV duration (β = 0.010, SE = 0.0017, t(145) = 6.18, ****p < 0.0001). E. P14 Power: There were no interactions (all p ≥ 0.36). Morphine Treatment was associated with increased power (β = 2.32, SE = 0.97, t(145) = 2.39, *p = 0.018). F. P14 Frequencies: Morphine Treatment was associated with reduced low frequency (β = −3.38, SE = 0.79, t(145) = −4.27, ****p < 0.0001), a greater change in frequency (β = 5.41, SE = 0.93, t(145) = 4.04, ****p < 0.0001), reduced principal frequency (β = −.89, SE = 0.73, t(145) = −2.59, *p = 0.011), and reduced peak frequency (β = −1.72, SE = 0.77, t(145) = −2.23, *p = 0.027). There was no effect of Morphine Treatment on high frequency (β = 1.43, SE = 0.93, t(145) = 1.54, p = 0.13). SAL, n = 75 (42F, 33M); MOR, n = 67 (33F, 34M).

