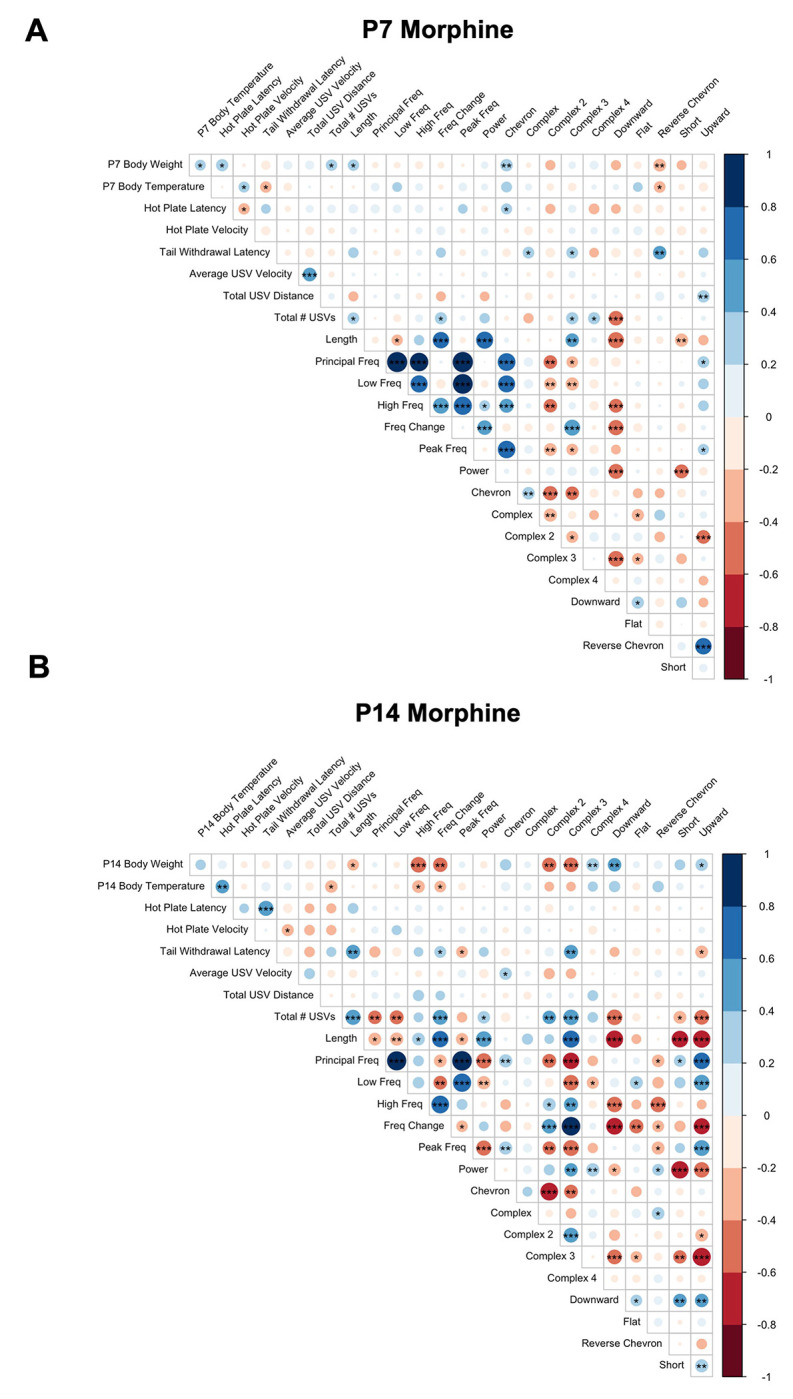
Figure 6. Correlation of withdrawal traits in morphine-withdrawn FVB/N pups on P7 and P14.

Colors indicate Pearson’s correlation coefficient: blue = positive, red = negative. Darker colors reflect stronger correlations. *p < 0.01, **p < 0.001, ***p < 0.0001. P7, n = 54 (28F, 26M); P14, n = 44 (21F, 23M).
