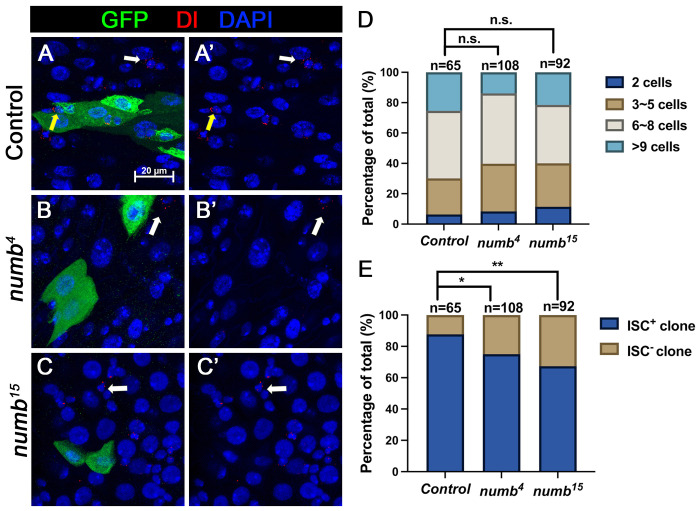
Figure 5. numb mutant clones exhibit weak stem cell loss phenotype.
(A-C’) Representative images of adult midguts containing MARCM clone (green) of FRT40 (Control) (A, A’), numb4 (B, B’), and numb15 (C, C’) and immunostained for Dl (red), GFP (green) and DAPI (blue) at 14 days after clone induction. GFP marks the clones. ISCs inside and outside the clones are indicated by yellow and white arrows, respectively. Scale bar (20 μm) is shown in (A).
(D) Quantification of clone size distribution for the indicated genotypes at 14 days after clone induction.
(E) Quantification of numbers of clones with or without ISC.
Data are mean ± SD from three independent experiments.*, p < 0.05, **, p < 0.01.

