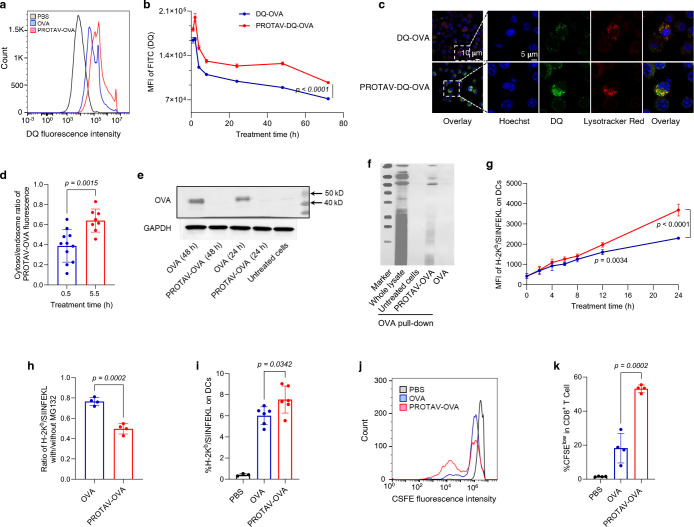
Fig. 3 |. PROTAV promoted antigen proteolytic processing and facilitated antigen presentation in DCs in vitro and in vivo.
a-b, Representative flow cytometry graph (a) and MFI quantified from flow cytometry data (b) showing that PROTAV-OVA-DQ facilitated OVA-DQ degradation (antigen processing) than OVA-DQ in DCs after a 24-h treatment (a) and over the course of 72 h post treatment (b). c, Confocal microscopy images showing stronger DQ fluorescence recovery of DCs treated with PROTAV-OVA-DQ than cells treated with OVA-DQ (1 h). d, The ratios of cytosolic over endolysosomal DQ fluorescence intensities in DCs, after treatment for 0.5 h and 5.5 h, respectively. Cells were treated with PROTAV-OVA-DQ for 0.5 h. One group of cells were subject to imaging, and the other group of cells were washed with cell culture medium to remove extracellular PROTAV-OVA-DQ, followed by another 5-h incubation before imaging. Data were quantified from confocal microscopy images. e, A WB image showing that after DCs were treated with PROTAV-OVA and OVA, respectively, PROTAV-OVA resulted in elevated OVA degradation relative to OVA after the corresponding treatment durations (24 h or 48 h). f, A co-IP image showing that PROTAV-OVA promoted the ubiquitination of OVA relative to unconjugated OVA in DC2.4 cells after treatment for 12 h. g, MFI of H-2Kb/SIINFEKL on DCs quantified from flow cytometry data showing that PROTAV-OVA promoted the presentation of SIINFEKL antigen epitope on DCs over the course of 24-h treatment. H-2Kb/SIINFEKL on DCs was stained using a dye-labeled antibody. h, Protease inhibitor MG132 offsets the ability of PROTAV-OVA to facilitate antigen presentation on DCs. In g-h, vaccines were transfected into DCs using lipofectamine 2000. i, Quantified flow cytometry results showing the percentage of H-2Kb/SIINFEKL-positive DCs among total live DCs from draining inguinal lymph nodes in C57BL/6 mice treated with PROTAV-OVA-DQ or OVA-DQ, respectively. Vaccines were s.c. administered at mouse tail base (dose: 10 μg OVA or PROTAV-OVA, 2 nmole CpG). j-k, Representative flow cytometry graphs (j) and quantified flow cytometry results showing the CFSE-low OT-1 CD8+ T cells upon co-culture (96 h) with DCs pre-treated (24 h) with PROTAV-OVA or OVA, respectively. This suggests that relative to OVA, PROTAV-OVA promoted the ability of DCs to expand antigen-specific T cells, as indicated by the CFSE signal dilution of OT-1 cells during cell division. 10 mg/mL PROTAV-OVA or OVA was used in all in vitro studies. Data represent mean ± s.e.m.; statistical analysis was conducted by one-way ANOVA with Bonferroni post-test.

