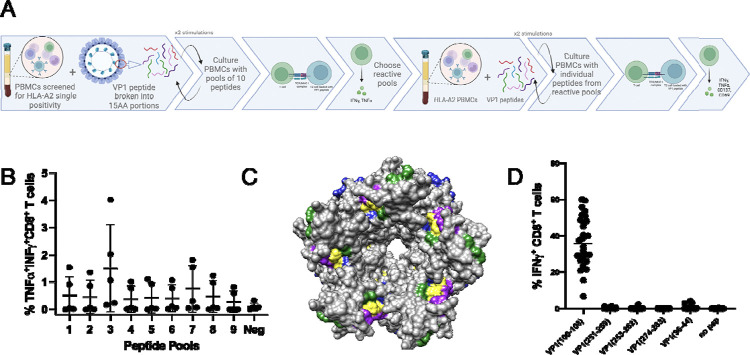
Figure 1: Defining immunogenic peptide.
A. Schematic of experimental layout. B. CD8+ T cells from 5 donors stimulated 3x with pools of 10 peptides, except pool 9 which had 6 peptides. C. 3D modeling of VP1 pentamer highlighting epitopes (Green: VP1 (100–108), Yellow: VP1 (251–259), (253–262), (274–283), Purple: Published epitopes, Blue: Predicted epitopes from IEDB. D. CD8+ T cells from 3 donors, 10 cell lines each, stimulated 3x with pools of peptides and then individual T2 IFN-γ response.

