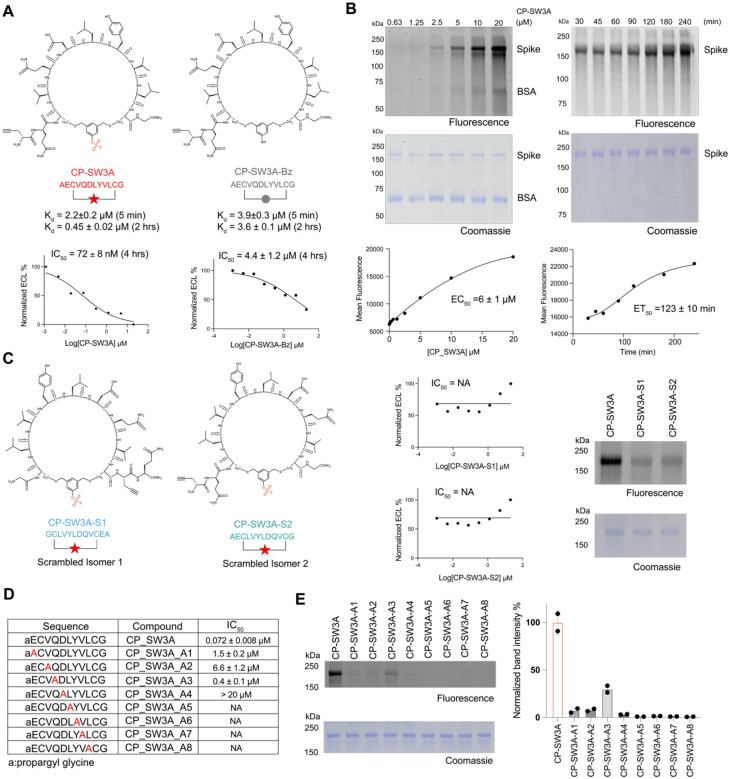
Figure 4. Biochemical validation of optimal hit CP-SW3A.
(A) Structures of the optimal hit CP-SW3A and the negative control compound CP-SW3A-Bz lacking the electrophile. The time dependent dissociation equilibrium constant Kd of the two compounds characterized using BLI at two different association time points (t=5min and 2 hr) are shown. IC50 values for inhibition activities after 4 hours of compound incubation to disrupt the interaction between Omicron BA2 spike and ACE2 using MSD assay are shown below. (B) Dose- and time-dependent labeling of the full-length spike Omicron BA2 variant by CP-SW3A. The alkyne labeled peptide was added at the indicated concentrations for 2 hrs or at the concentrations of 10 μM for the indicated times followed by CLICK labeling with azide-TAMRA. Labeled protein was resolved by SDS-PAGE followed by scanning of the gel for fluorescence (C) Structure of two scrambled isomers of CP-SW3A. Sequence of isomer S1 is fully reversed compared to the parental CP-SW3A, and sequence of isomer S2 is only reversed for the variable regions between the two cysteines. Inhibition activities of the two isomers using MSD assay are shown. NA: Not available. Labeling of the two isomers, along with the parental compound CP-SW3A, to spike protein is shown. For labeling, 0.25 μM spike was incubated with 10 μM compounds in PBS, 37 °C, for 2 hours. Labeled mixtures were clicked with azide-TAMRA via CuAAC click reaction, followed by fluorescence scanning and coomassie staining. (D) Evaluation of structure dependent labeling activity of CP-SW3A using positional alanine scanning mutants. Alanine was scanned across the variable amino acids except the first alkyne and last glycine, to yield 8 alanine mutants (annotated as A1-A8 in table). IC50 values for inhibition activities after 4 hours of compound pre-incubation to disrupt the interaction between Omicron BA2 spike and ACE2 using MSD assay are shown below. (E) Each mutant and the parental peptide was incubated at 10 μM with 0.3 μM spike in PBS for 2hr at 37C. Labeled mixtures were clicked with azide-TAMRA via CuAAC click reaction, followed by fluorescence scanning and coomassie staining. Band intensities in fluorescence imaging were quantified by two technical replicates using ImageJ. Quantification data was normalized to the parental molecule CP-SW3A.

