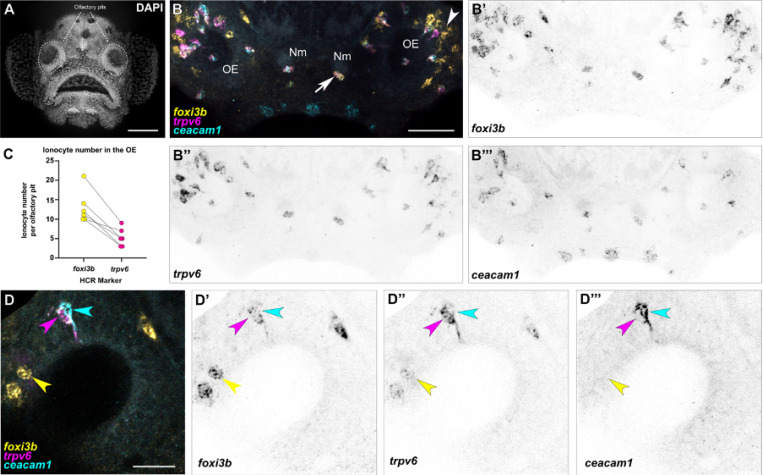
Figure 2. The larval zebrafish olfactory epithelium contains three distinct subtypes of ionocytes.
(A) Maximum intensity projection of a 4 dpf larva stained with DAPI showing the two olfactory pits; frontal view. Scale bar: 50 μm. (B–B’’’) Maximum intensity projection of a confocal image of HCR RNA-FISH for foxi3b (B’), trpv6 (B’’), ceacam1 (B’’’), and merged signals (B) in the head of a 5 dpf wild-type larva; dorsal view, anterior to the bottom. White arrowhead marks an example of an olfactory ionocyte in the posterolateral region of the olfactory pit with expression of foxi3b. White arrow marks an example neuromast ionocyte with expression of all three selected genes. Scale bar: 50 μm. Abbreviations: OE; olfactory epithelium, Nm; neuromast. (C) Numbers of foxi3b+ ionocytes per olfactory pit in 5 dpf larvae raised in 0.5× E2 medium, of which also express trpv6. Connecting lines indicate the same olfactory pit. (D–D’’’) Confocal image of HCR RNA-FISH signals for foxi3b (D’), trpv6 (D’’), ceacam1 (D’’’), and merged signals (D) in the olfactory epithelium of a 5 dpf wild-type larva; dorsal view, anterior to the bottom, lateral to the left. Magenta and cyan arrowheads mark an example pair of ionocytes, with the magenta arrowhead marking a strong trpv6-expressing cell, and the cyan arrowhead marking a ceacam1+ cell with weak foxi3b expression. Yellow arrowhead marks an example solitary ionocyte, which has strong expression of foxi3b and weak expression of trpv6. Scale bar: 20 μm.

