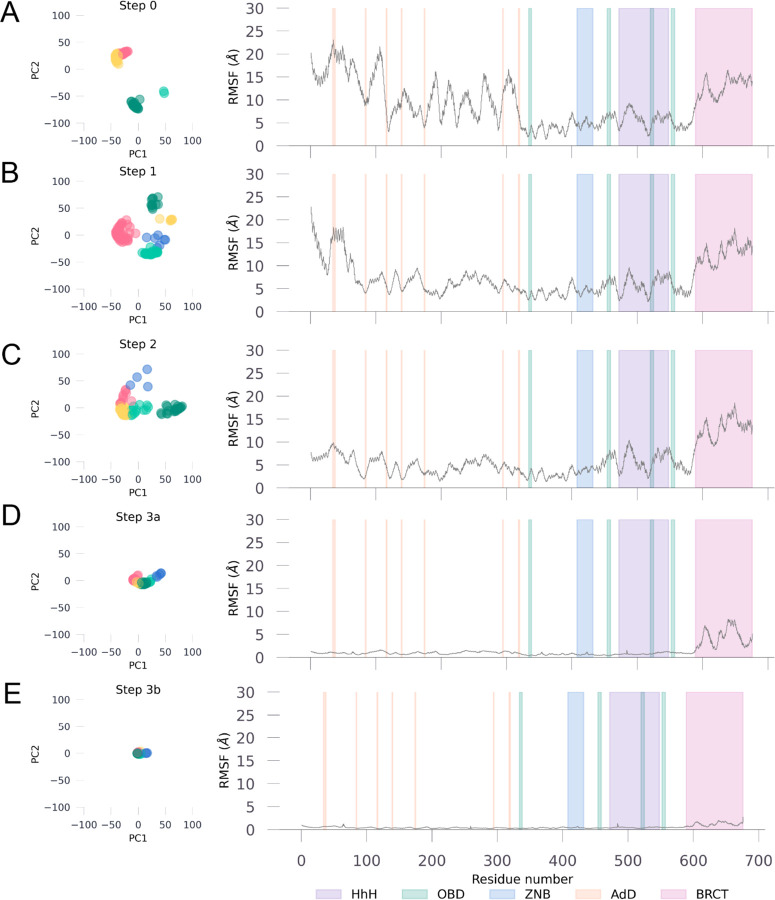
Figure 2. Domain-Specific Backbone PCA and RMS Fluctuations in Taq Ligase.
Left panel shows the Taq ligase backbone at that step reduced to 2 principal components for all models within the ensemble. Right panel shows the backbone fluctuations at each residue (root-mean square fluctuations) compared to an average structure calculated using all models from the ensemble at that step. Domains are color coded per the key given at the bottom right corner.

