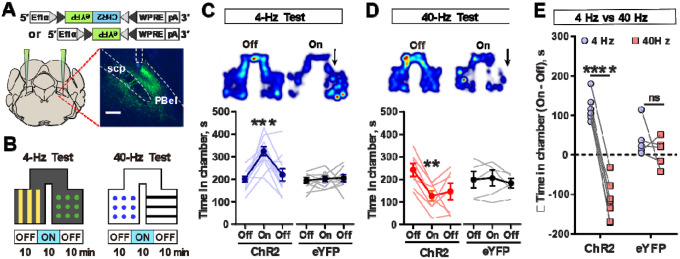
Figure 4. Stimulation of CGRPPBel neurons at differing frequencies induces opposing responses.
(A) Schematic of injections. Inset image shows the expression of ChR2-eYFP in CGRPPBel neurons. Scale bar, 200 μm.
(B) Schematic of real-time place preference or aversion test (RTPP/RTPA), paired with 4 Hz or 40 Hz stimulation.
(C) Heatmap during RTPP using 4 Hz photostimulation (top). Time spent in chamber for ChR2 and eYFP injected animals (bottom). (ChR2 N = 11; eYFP N = 9).
(D) Heatmap during RTPA using phasic 40 Hz photostimulation (top). Time spent in chamber for ChR2 and eYFP injected animals (bottom). (ChR2 N = 7; eYFP N = 5).
(E) Light-induced changes in time spent in the paired chamber.
****P < 0.0001, ***P < 0.001, **P < 0.01. Data are presented as mean ± s.e.m.

