FIG. 3.
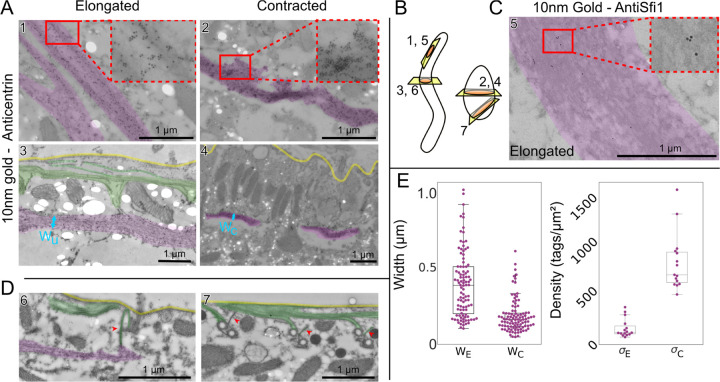
Immunogold TEM reveals changes in centrin-dense myoneme fibers. Images highlighted for myoneme bundles (magenta), plasma membrane (yellow) and microtubules (green). A Representative example images immunogold labeled with 20H5 anti-centrin. In elongated cells (left, images 1 and 3), myoneme bundles appear as a loose meshwork with some long connected fibers, while in contracted cells (right, images 2 and 4), bundles appear as dense structures with no discernible fine details. There are holes present in some samples (bright white ovals) due to the fragility of the uncoated grids used to increase labeling efficiency. B Cartoon showing approximate direction of cuts. C Representative TEM image of elongated myoneme bundle labeled with Sc_25973_2 (anti-Sfi1). D Example images of connections (red arrows) between myoneme and microtubule cytoskeletons at basal bodies. The left (elongated cell) and right (contracted cell) images show perpendicular perspectives (see B) of similar structures in different cells. E Quantification of myoneme fiber width (left) measured perpendicular to the cell membrane (elongated: N=4 images with 3 preparation repeats, contracted N=5 images with 3 preparations) and tag density (right; 15 measurements shown, 3 repetitions of the preparation, measurement is average over a fiber). Each preparation contained multiple cells; it is unknown whether the images in a single preparation were of different cells.

