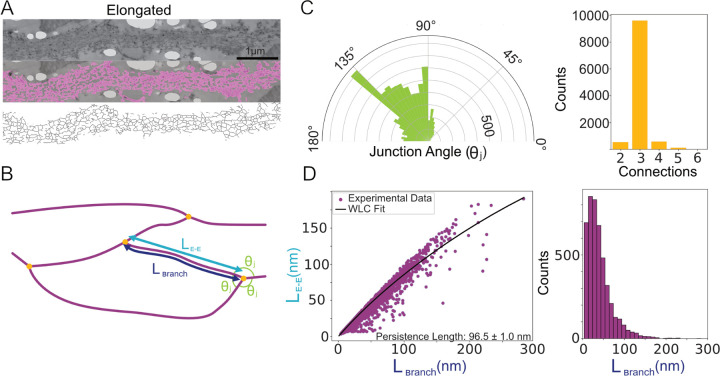
FIG. 4.
Skeletonization analysis reveals structural features of elongated myonemes. A Selected image showing segmentation analysis (magenta) and skeletonization. B Cartoon showing features quantified from the skeletonization. Branches (magenta) of segment lengths Lbranch and end-to-end distances LE−E meet at intersections (yellow dots) with junction angles θj. C Polar histogram of junction angles (left) and number of branches at each intersection (right) (N=5 images, 10,816 total measurements). D Left, plot of branch length versus end-to-end length, fit to a worm-like chain (WLC) model (see Methods) to estimate the persistence length. Right, histogram of branch lengths (excluding dead end branches), demonstrating notable variation.

