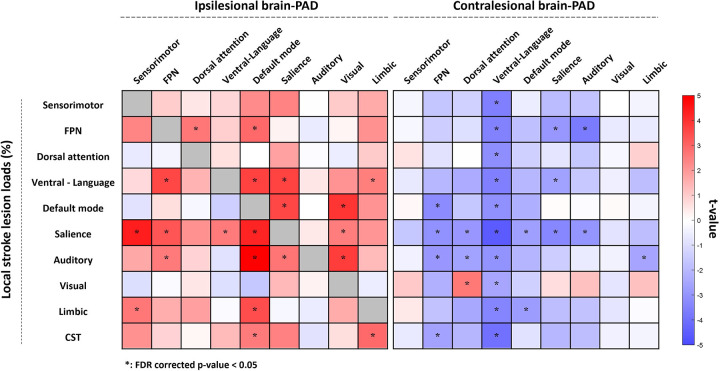
Figure 4. Results of the association analysis between lesion loads and regional brain-PAD.
Each square represents the association between regional brain-PAD (x-axis) and lesion load (y-axis). A darker red color indicates higher brain-PAD (older appearing brain), while a darker blue color indicates lower brain-PAD (younger appearing brain). As the brain age in lesional regions (i.e. a lesion load in the ROI for which brain-PAD was computed > 20%) was not computed due to a potentially false brain age prediction, the correlation analyses in the diagonal cells were not performed and colored in gray. The asterisk denotes a significant result (p < 0.05) after False Discovery Rate (FDR) correction. Higher local stroke lesion loads showed correlations with higher ipsilesional and lower contralesional regional brain-PADs. Specifically, ipsilesional regional brain-PADs of FPN, default mode, salience, and visual networks and contralesional regional brain-PADs of FPN, dorsal attention, ventral attention-language, and salience networks were influenced by at least 3 lesion loads. Lesion load in the salience network showed widespread significant influence on both ipsilesional (sensorimotor, FPN, ventral attention-language, default mode, and visual networks) and contralesional regional brain-PAD (FPN, dorsal attention, ventral attention-language, default mode, salience, and auditory networks).

