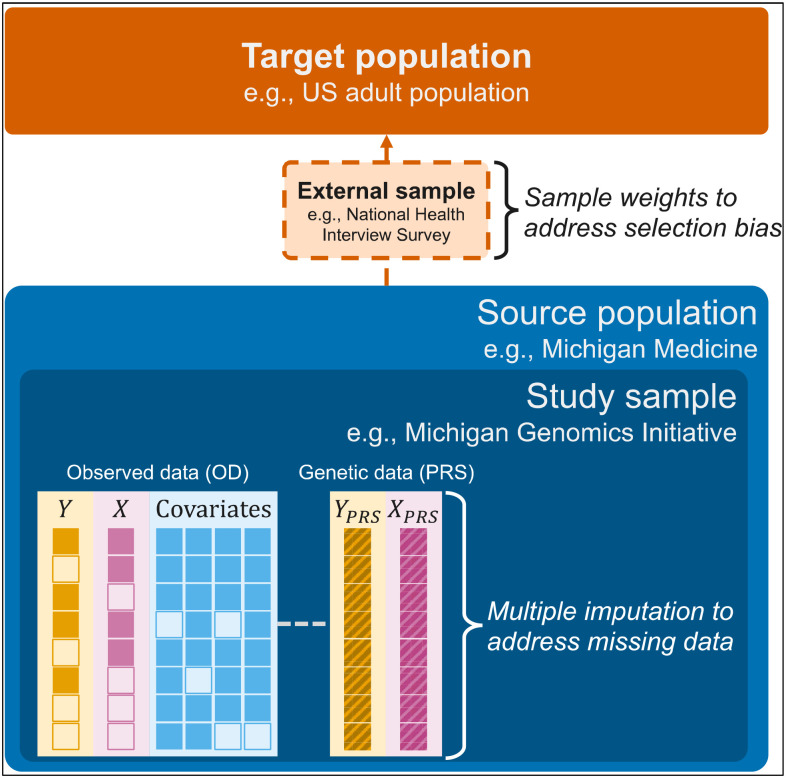
Figure 1.
Schematic representation depicting multiple imputation and weighted analyses to jointly address missing data and selection bias. Y represents the outcome (e.g., glucose), X represents the exposure (e.g., body mass index) and covariates could include age, sex, race/ethnicity, and smoking status. The empty boxes represent missing data. YPRS and XPRS are the polygenic risk scores (PRS) corresponding to the outcome and exposure, respectively.

