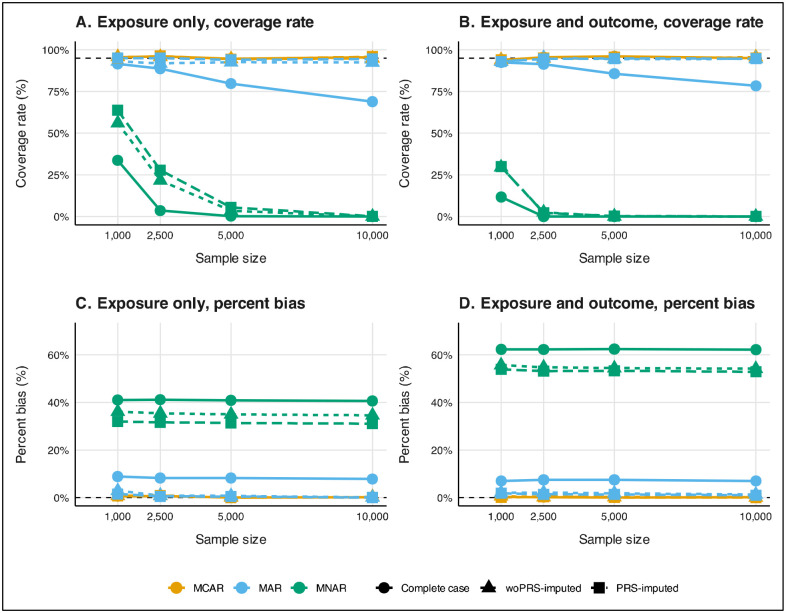
Figure 3.

Coverage rate (panels A and B) and percent bias (panels C and D) diagnostics for exposure only (panels A and C) and exposure and outcome missingness (panels B and D) BMI coefficient for glucose by missing data mechanism and method and sample size under random sampling in a 1,000-iteration simulation. Analyses were adjusted for age, sex, non-Hispanic White, and smoking status (ever/never). Corresponding coverage rate, percent bias, average confidence interval width, and root mean squared error diagnostics are reported in Supplementary Table 2 and Supplementary Table 3. Abbreviations: MAR, missing at random; MCAR, missing completely at random; MNAR, missing not at random; PRS-imputed, polygenic risk score-informed multiple imputation; woPRS-imputed, multiple imputation without exposure and outcome PRS.
