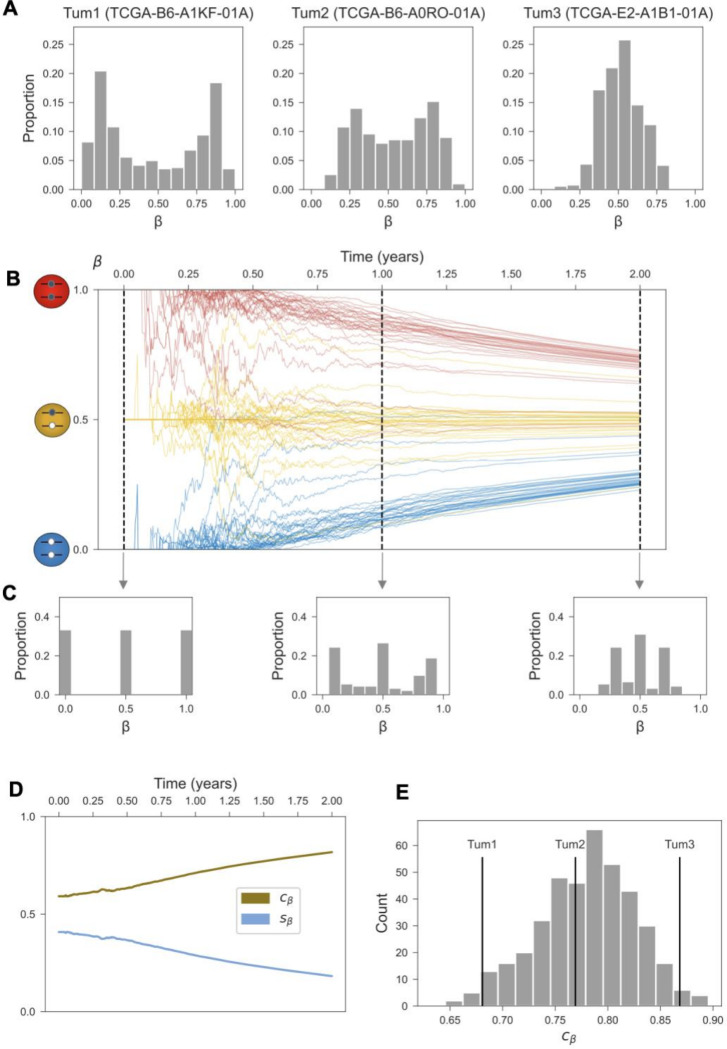
Figure 3. The distribution -values across the clock set encodes tumor age.
(A) The empirical -value distributions for the clock set fCpGs (N=500) are shown for three select tumors in the TCGA cohort. (B) Simulated trajectories for an ensemble of fCpG sites (N=90), starting in the unmethylated, hemi-methylated, and methylated initial configurations, respectively (n = 30 each). The thick lines represent the average -value trajectories for each subset. Simulation parameters as detailed in Figure 1. (C) Cross-sectional -value distributions for the simulated clock set in panel B, shown after 0,1, and 2 years of growth. (D) Standard deviation () of -values and epigenetic clock index () over 2 years of growth for the simulated clock set in panel B. (E) The distribution of epigenetic clock index values across invasive ductal carcinomas in TCGA (N=400); the three tumors from are labeled.

