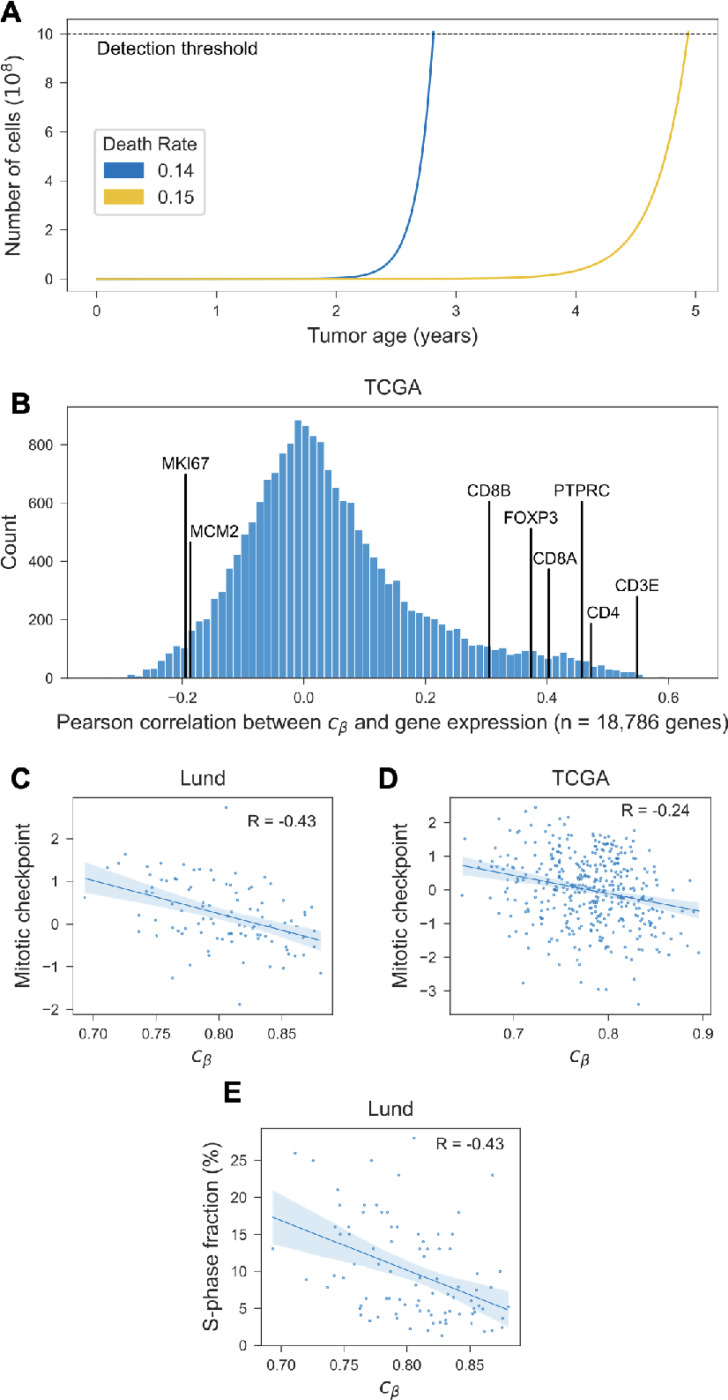
Figure 5. Mitotic tumor age vs. measures of proliferation.
(A) Simulation of tumor size as a function of tumor age. Both tumors have the same proliferation rate ( divisions/day), but different death rates: day (blue) vs. 1/day (yellow). (B) Pearson’s correlation between epigenetic clock index and expression of protein-coding genes (TCGA cohort); correlation with select genes as indicated. (C)-(D) Correlation of with average expression of genes involved in M-phase and mitotic checkpoint regulation. (E) Correlation of with the fraction of cells in S-phase, as measured by flow cytometry (Lund cohort). Regression lines shown with bootstrapped 95% confidence intervals and Pearson correlation (R).

