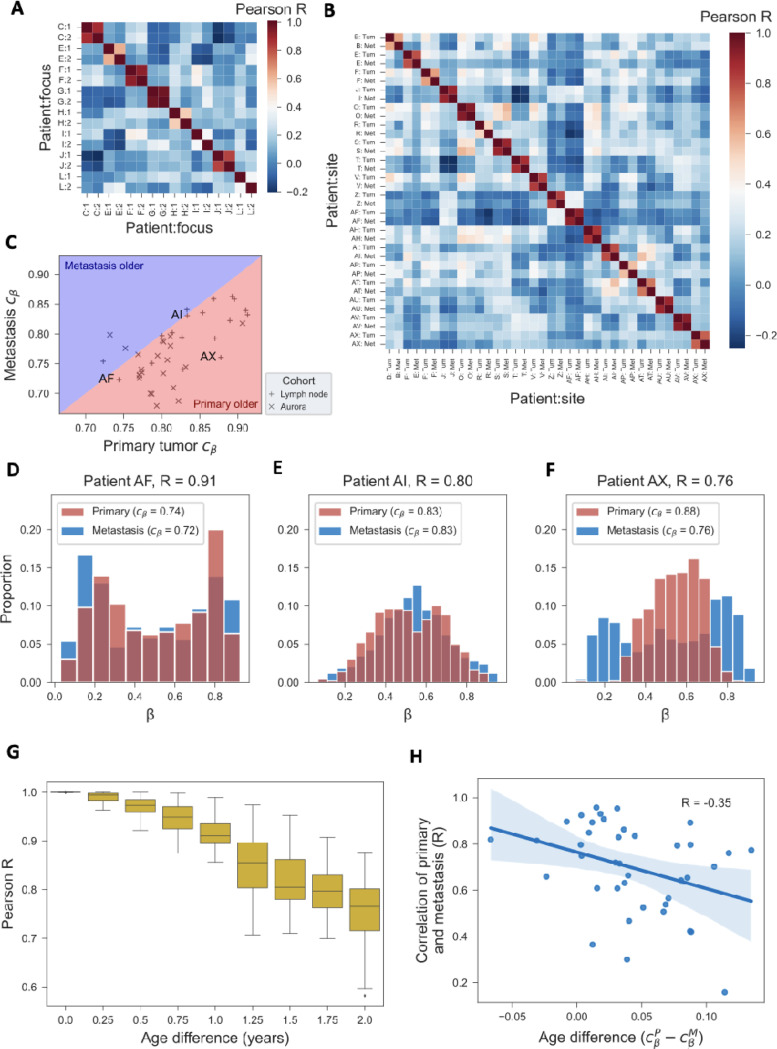
Figure 7. Paired tumor samples.
(A) In a cohort of 8 patients with multifocal breast cancer, the -values of the 500 fCpG sites of the epigenetic clock are correlated within (two foci per patient) and between patients. (B) In a cohort of 18 patients with paired primary tumor and lymph node metastasis samples, the -values of the 500 fCpG sites are correlated within and between patients. (C) For the 18 patients from panel B and 22 patients from the AURORA US Metastasis Project, the epigenetic clock index of the primary tumor is plotted against the index of the lymph node metastasis. Three patients (AF, Al, and AX) from the lymph node cohort are labeled for the purposes of the following 3 panels. (D-F) For the 3 labeled patients from panel C, the -value distributions of fCpGs are shown both for the primary tumor and the metastasis. (G) Monte Carlo simulation of an ensemble of 90 fCpG sites, 30 each starting in the unmethylated, hemi-methylated, and methylated initial configurations; every 3 months, a cell was randomly picked to representing the metastasis seeding cell, and the Pearson correlation between the -value distribution of that cell and that of the entire tumor was calculated. Distributions at each time point represent the results from 30 independent simulations. Simulation parameters are detailed in Figure 1. (H) For the 18 patients from panel B and 22 patients from the AURORA US Metastasis Project, the epigenetic relatedness of primary and lymph node metastasis (Pearson’s R for the 500 fCpG sites in the clock set) is compared to the difference in epigenetic clock index, as a proxy for the difference in mitotic age between the two samples.

