
Fig. 4.
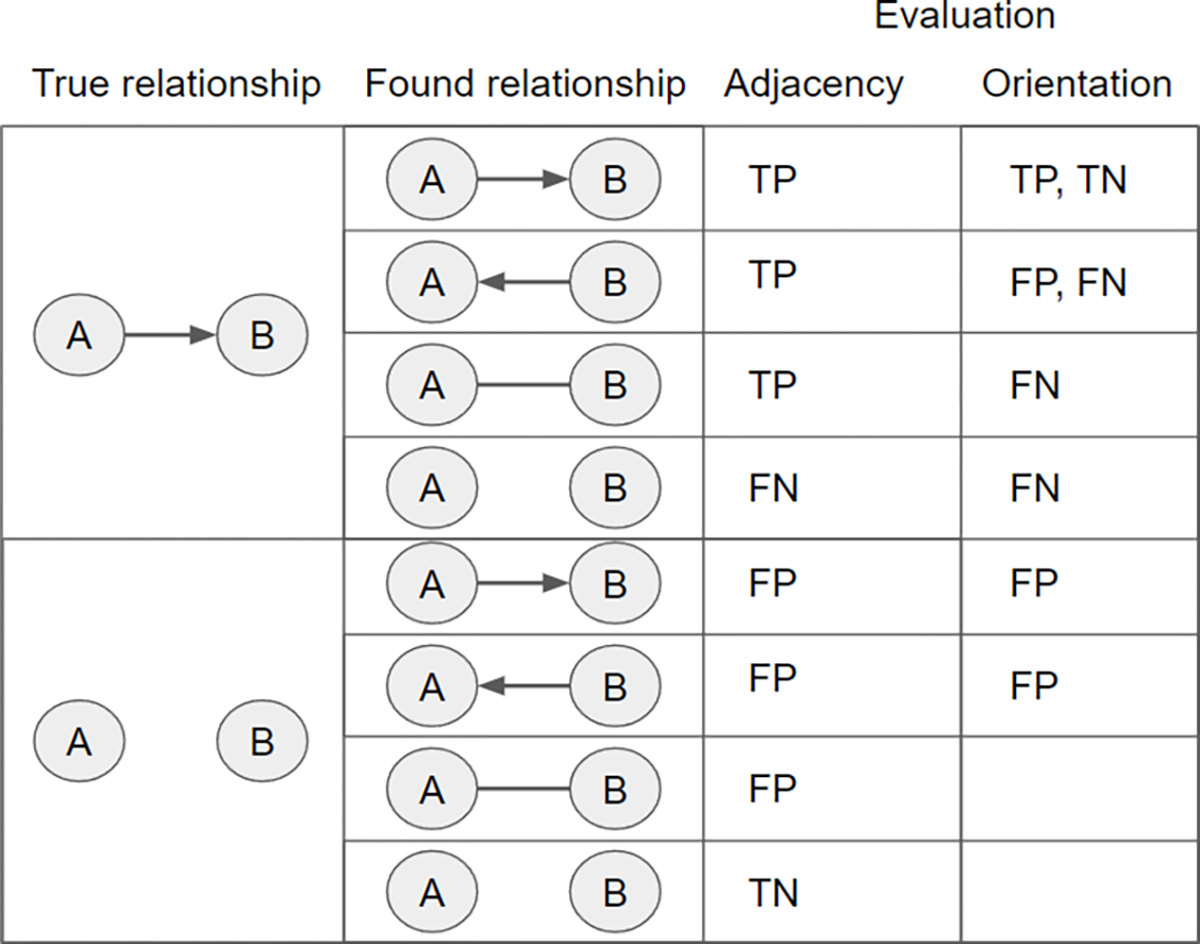
A table indicating how the elements of the confusion matrix for adjacency performance, and for orientation performance, are calculated. The two cells are empty in the lower right because they do not contribute to any of the orientation performance metrics.